Which county in America has the most Superfund sites?
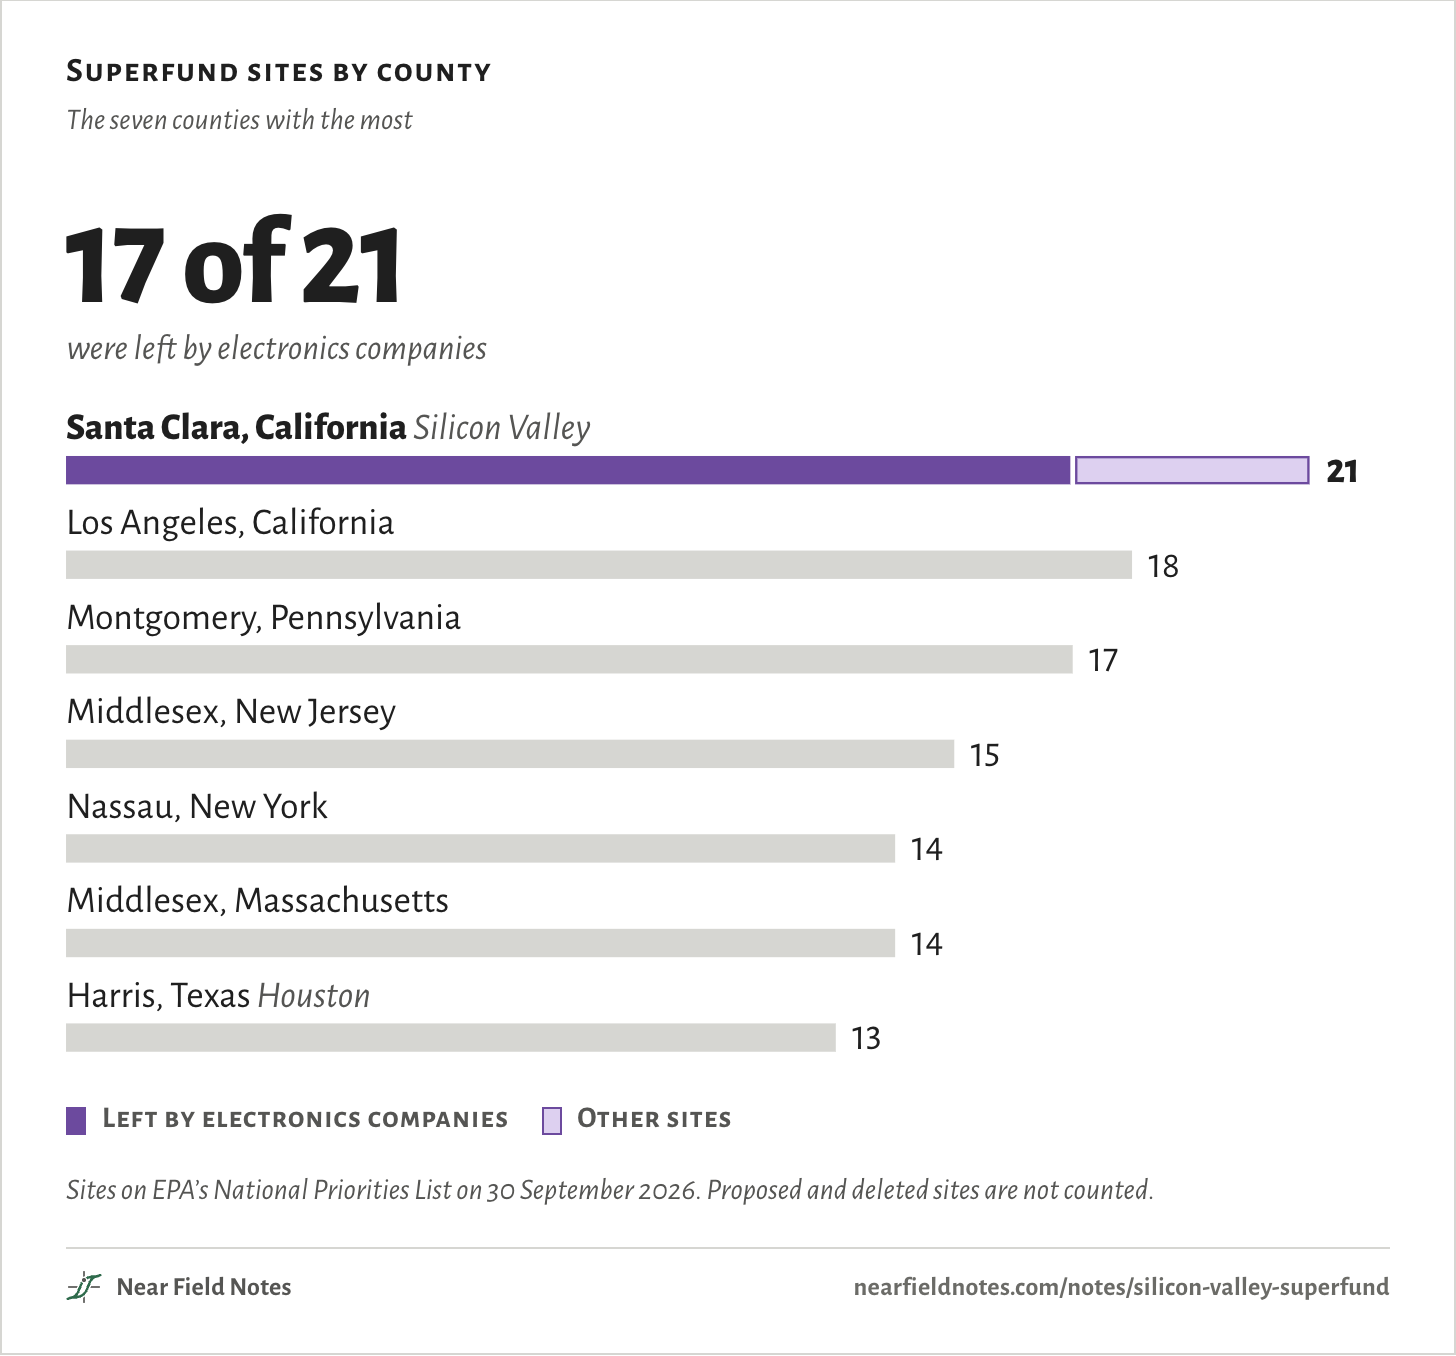
Santa Clara County, California: Silicon Valley. It has 21 sites on EPA’s list, against 13 around Houston, and electronics companies left 17 of them. Solvents leaked from buried tanks, sumps and pipes at the chip plants. The cleanup has run for more than 40 years, and EPA expects it to take many more decades.
Superfund sites by county
The seven counties with the most
Left by electronics companies
Other sites
Sites on EPA’s National Priorities List on 30 September 2026. Proposed and deleted sites are not counted.
The valley before chips
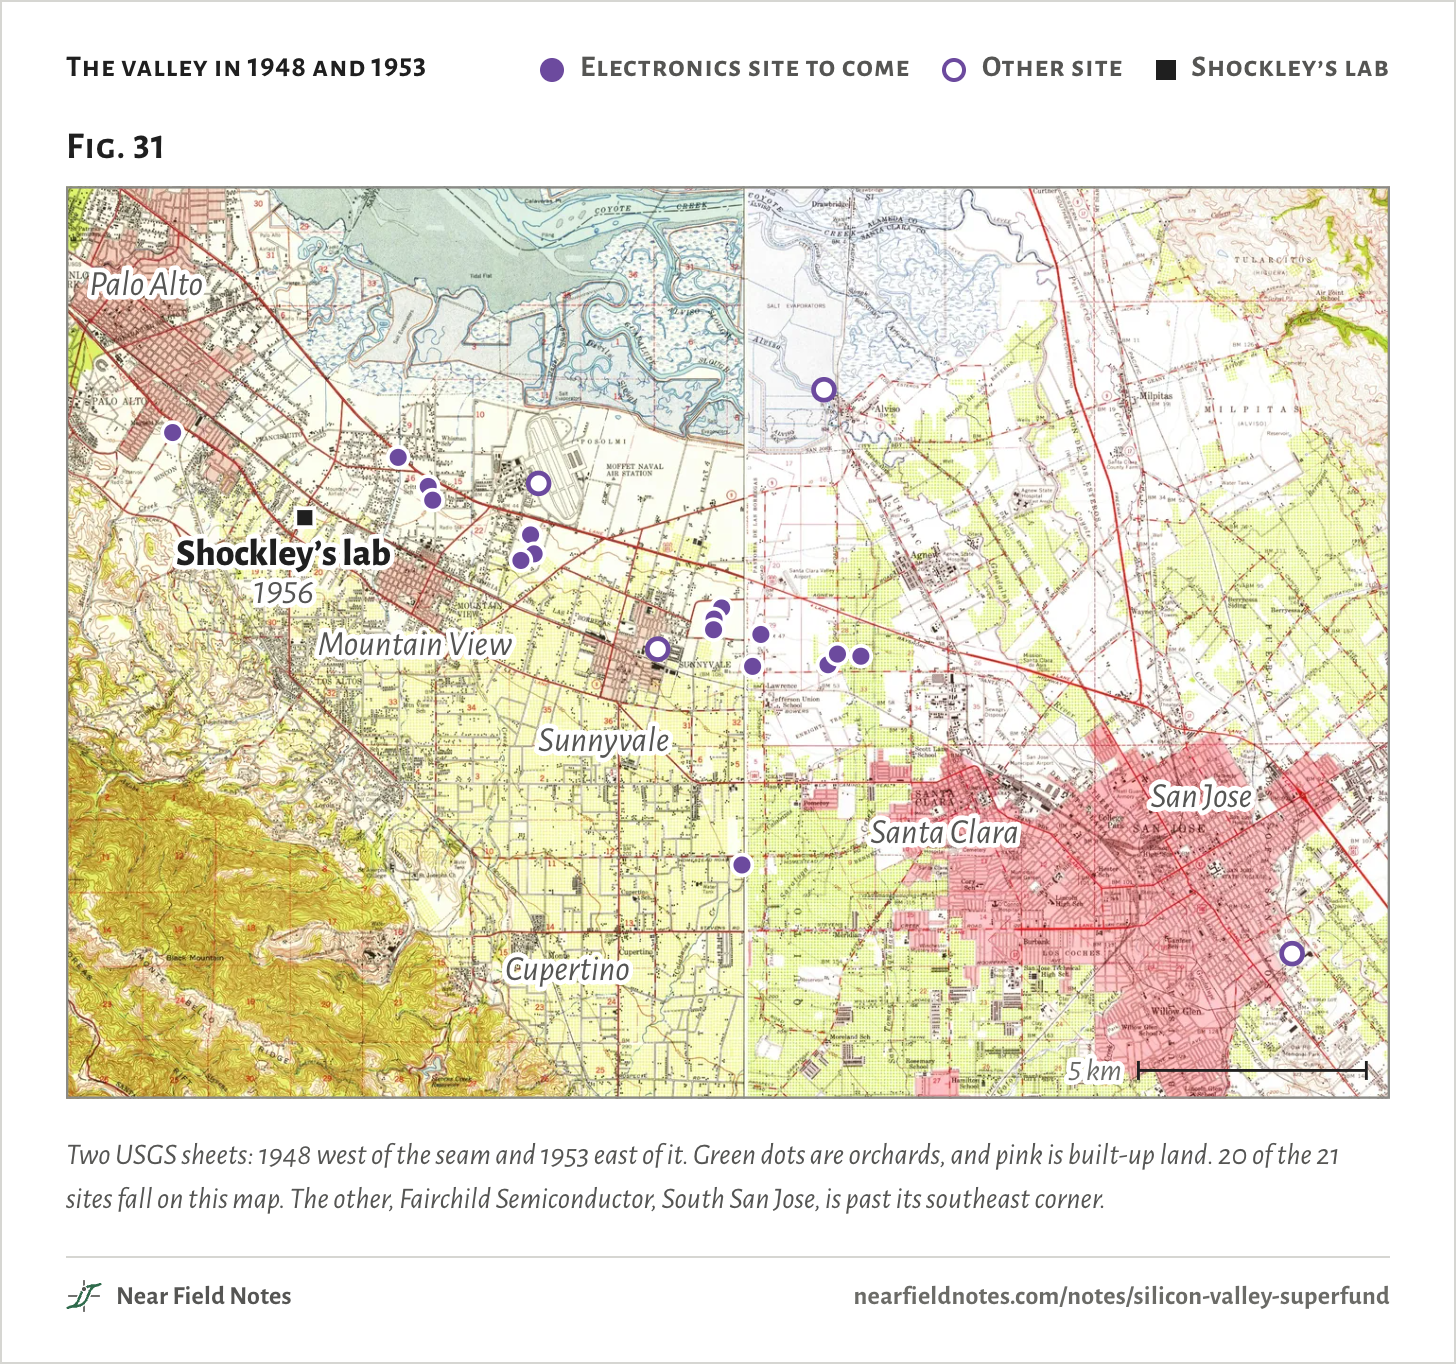
Santa Clara Valley, 1948 to 1953
Superfund is the federal program for the country’s worst hazardous-waste sites, and its National Priorities List names them. Seventy years ago nothing here belonged on such a list. This was the Valley of Heart’s Delight, with about 106,000 acres of fruit and nut trees around 1940, more than half of them prunes.
In 1956 William Shockley opened a transistor lab in an old fruit-packing shed in Mountain View. Eight of his staff left to start Fairchild Semiconductor in 1957. Fairchild’s people went on to start Intel in 1968 and AMD in 1969, and the chip plants went up where the orchards had been.
The valley in 1948 and 1953
Electronics site to come
Other site
Shockley’s lab
Two USGS sheets: 1948 west of the seam and 1953 east of it. Green dots are orchards, and pink is built-up land. 20 of the 21 sites fall on this map. The other, Fairchild Semiconductor, South San Jose, is past its southeast corner.
Why chip plants kept solvents
The chemistry
Making a chip means cleaning a silicon wafer again and again, because one speck of grease can ruin it. The plants wanted solvents that cut grease and would not catch fire, and chlorinated solvents did both. The main one was trichloroethylene, or TCE. From the 1960s many plants moved to a close relative, TCA.
What each chemical did
Fig. 31b
Chemical
Job in the plant
Found in the ground at
TCE
Degreasing wafers and parts
Fairchild, Raytheon and Intel in Mountain View
TCA
Cleaning and degreasing, in place of TCE
Fairchild in South San Jose, IBM
Freon 113
Cleaning, and removing flux
Applied Materials, Intel in Santa Clara
PCE
Cleaning
AMD, Applied Materials, Intersil
Acetone, alcohol, xylene
Photoresist work and cleaning
The same waste tanks as the solvents above
Acids
Etching and cleaning
Neutralizing tanks and sumps
Jobs from EPA’s 1995 notebook on the electronics industry. Places from EPA’s listing of each site. TCE is trichloroethylene, TCA is 1,1,1-trichloroethane and PCE is tetrachloroethylene.
310
Chlorinated solvents
They cut grease, they do not burn, and they sink
Field marks. TCE, TCA and PCE dissolve grease and do not catch fire. All three are heavier than water. TCE weighs 1.46 times as much.
Look-alike. TCA took over from TCE as the safer choice. It was later phased out for damaging the ozone layer.
Range. EPA and the International Agency for Research on Cancer both class TCE as a cause of cancer in people, on the evidence for kidney cancer. The drinking-water limit is 5 parts per billion for TCE and 200 for TCA.
Habitat. Local fire codes had flammable chemicals stored underground, and the solvents and their waste went into buried tanks too. The tanks had no leak detectors.
311
From the street the plants showed lawns and no smokestacks. Janet Gray Hayes, San Jose’s mayor in those years, said later: “There was no doubt in my mind that this was a clean industry.”
1981: a tank leaks in South San Jose
Fairchild Semiconductor, 101 Bernal Road
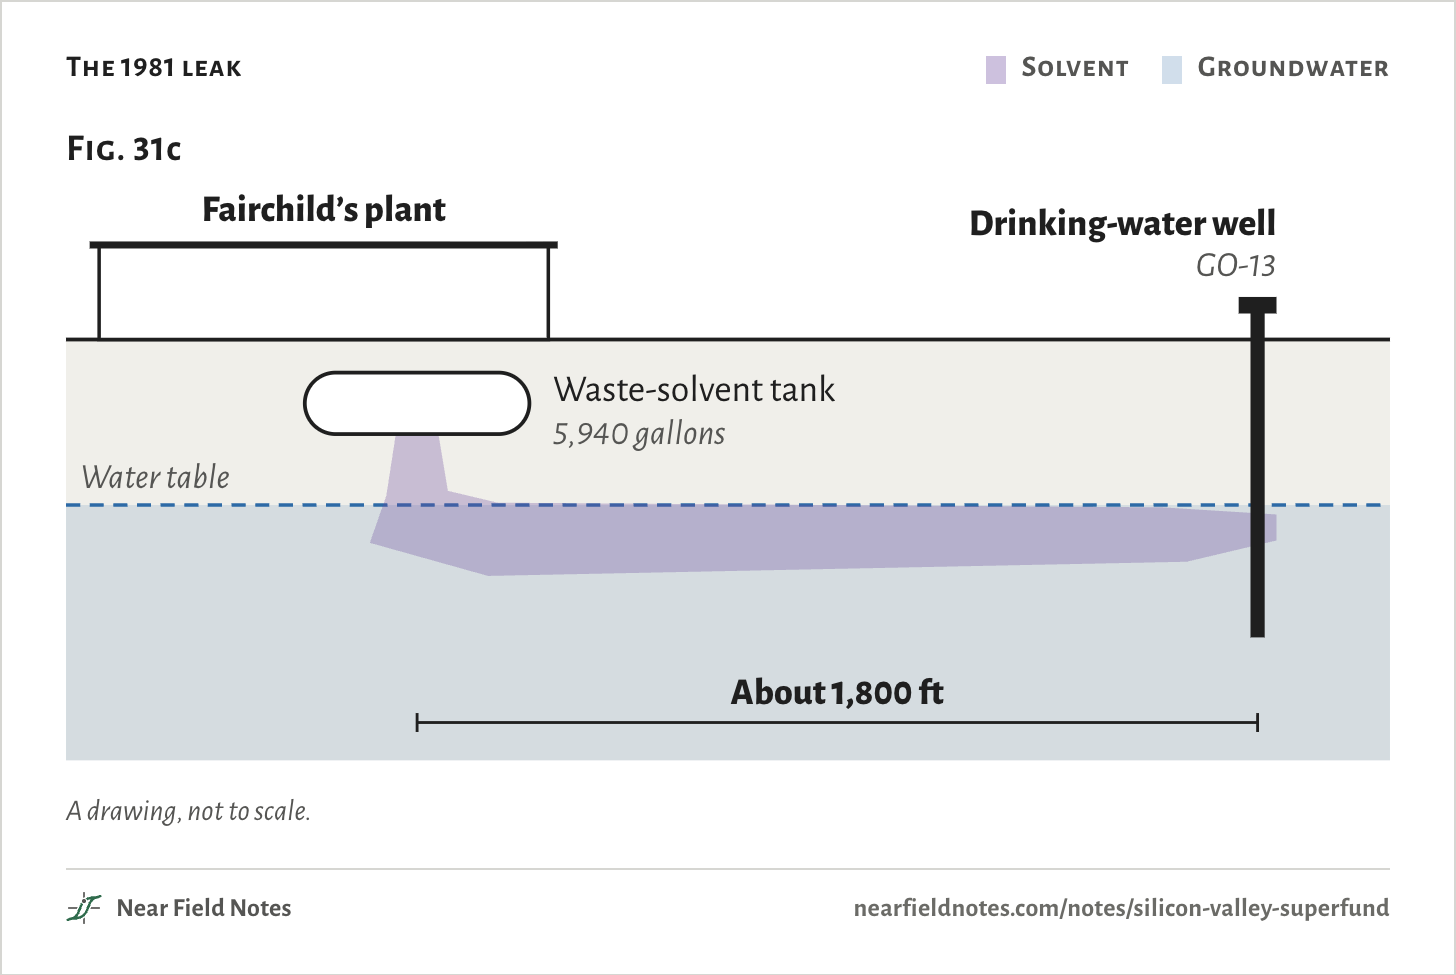
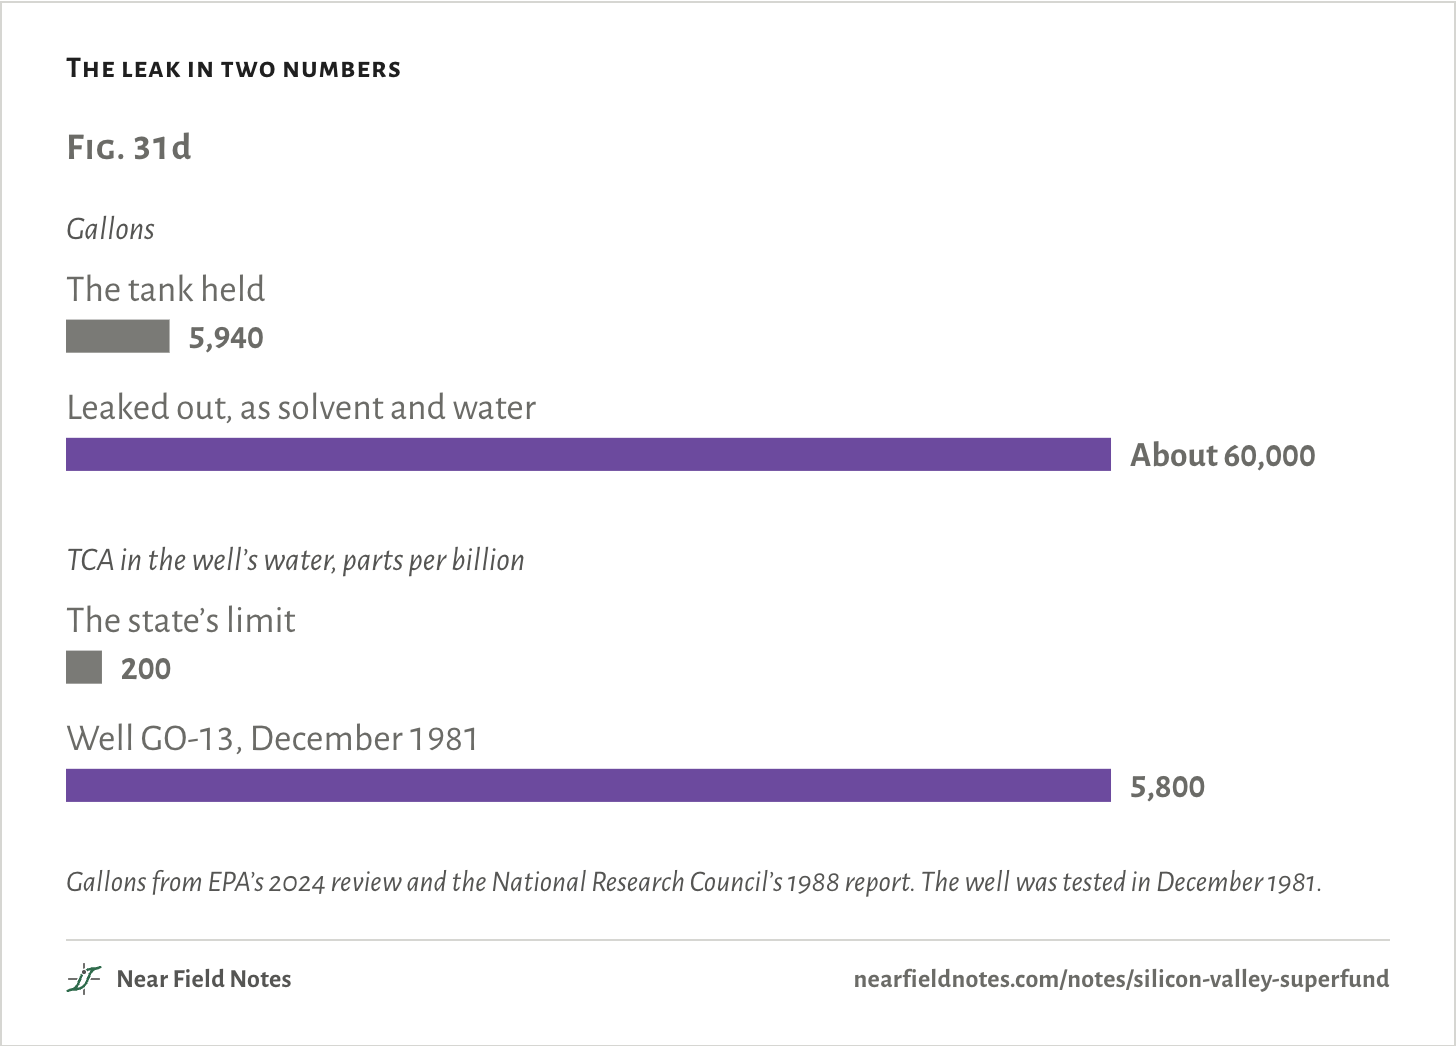
In late 1981 Fairchild found that a buried waste-solvent tank at its South San Jose plant had failed. The tank held 5,940 gallons. About 60,000 gallons of solvent and water had gone into the ground, because the plant kept refilling it for at least a year and a half. The solvent was mostly TCA.
The 1981 leak
Solvent
Groundwater
A drawing, not to scale.
The leak in two numbers
Gallons from EPA’s 2024 review and the National Research Council’s 1988 report. The well was tested in December 1981.
312
The 1981 leak
About ten tankfuls went into the ground
Field marks. About 1,800 ft away, drinking-water well GO-13 tested at 5,800 parts per billion of TCA, 29 times the state’s limit. The water company shut it on 7 December 1981.
Look-alike. This leak was TCA. The TCE sites are in Mountain View, about 19 miles to the northwest.
Range. The plant made chips for six years, from 1977 to 1983. A wall was built underground around the source in 1986, and the site is still on the list.
Habitat. It was not the first. IBM had reported a solvent leak at its disk-drive plant nearby in October 1980, and Hewlett-Packard found a leaking tank in Palo Alto in July 1981.
313
Neighbors in Los Paseos, across Bernal Road from the plant, counted birth defects and miscarriages among themselves and took the count to the city. California’s health department studied it. It found a real excess in that neighborhood in 1980 and 1981: about twice the miscarriages and three times the birth defects of a similar neighborhood on other water. Its later studies modeled where the well’s water had gone and concluded that the leak was unlikely to be the cause. A lawsuit by 530 residents was settled in 1986, and the terms were sealed.
Everyone else checks
Santa Clara Valley, 1982 to 1985
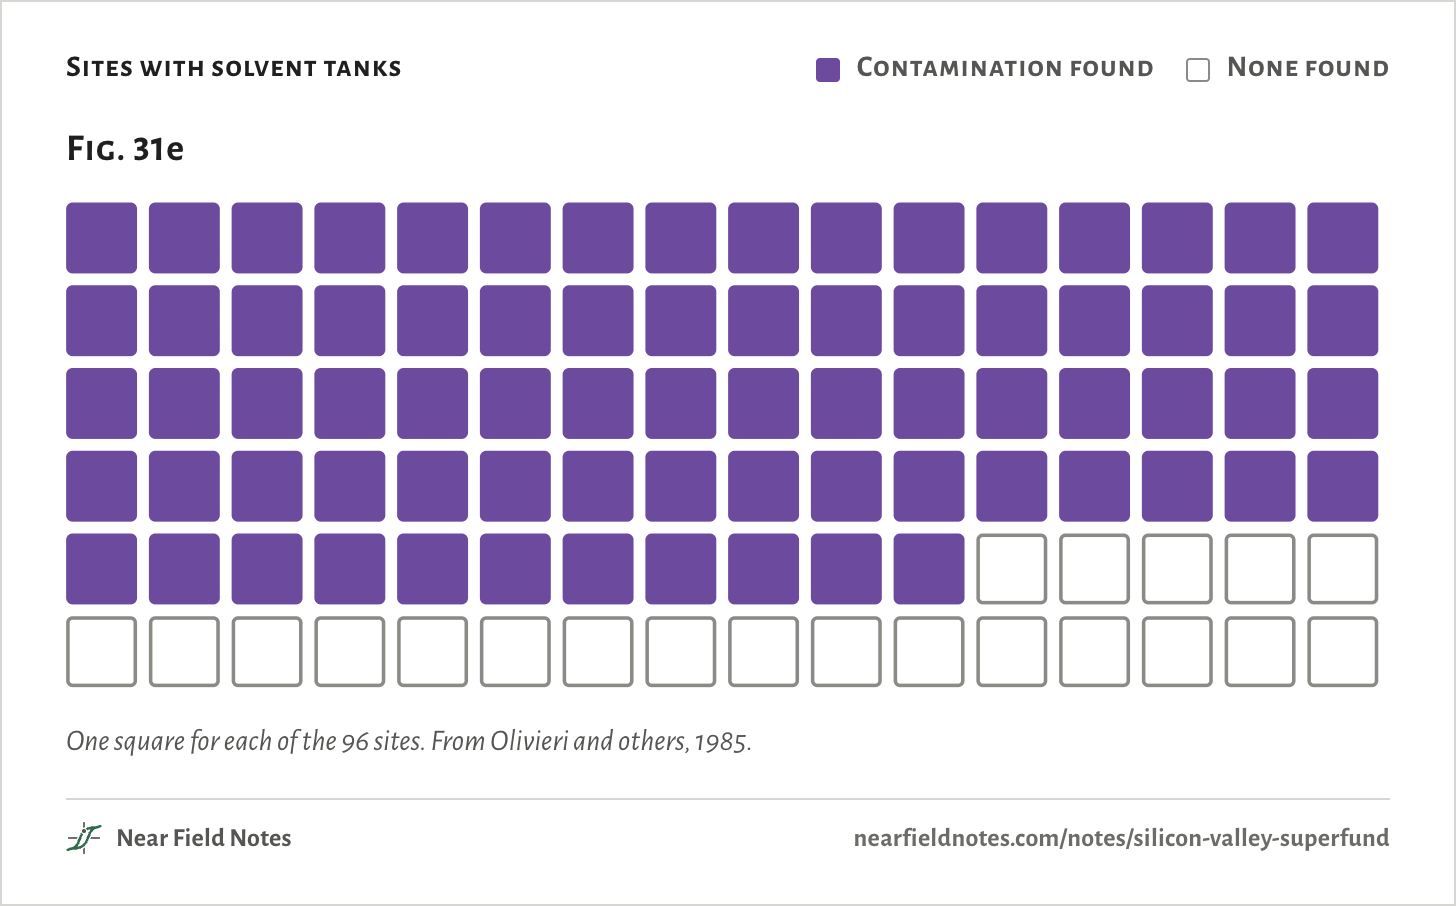
After Fairchild, the regional water board asked the valley’s other plants about their tanks. A survey counted 1,692 underground tanks at 388 sites. Of the 96 sites with solvent tanks, 75 had contaminated the ground. “We were batting 1,000,” the water board’s Wil Bruhns said later. “Anyone who looked for leaks found them.”
Sites with solvent tanks
Contamination found
None found
One square for each of the 96 sites. From Olivieri and others, 1985.
314
The tank survey
75 of 96 had leaked
Field marks. The leaks came from tanks, from acid-neutralizing sumps and from pipes. At Intel’s first plant, acid had eaten through the bottoms of the sewer pipes.
Look-alike. A sound tank could still leak. Crews overfilled tanks, drained delivery hoses onto the ground and mixed chemicals that attacked a tank’s walls.
Range. In 1983 the county’s cities adopted a storage ordinance for hazardous materials, and California passed the country’s first law on underground tanks. New tanks needed a second wall and leak monitoring.
Habitat. On 15 October 1984 EPA proposed 19 South Bay sites for the Superfund list in a single day.
315
The 21 sites
Santa Clara County, 2026
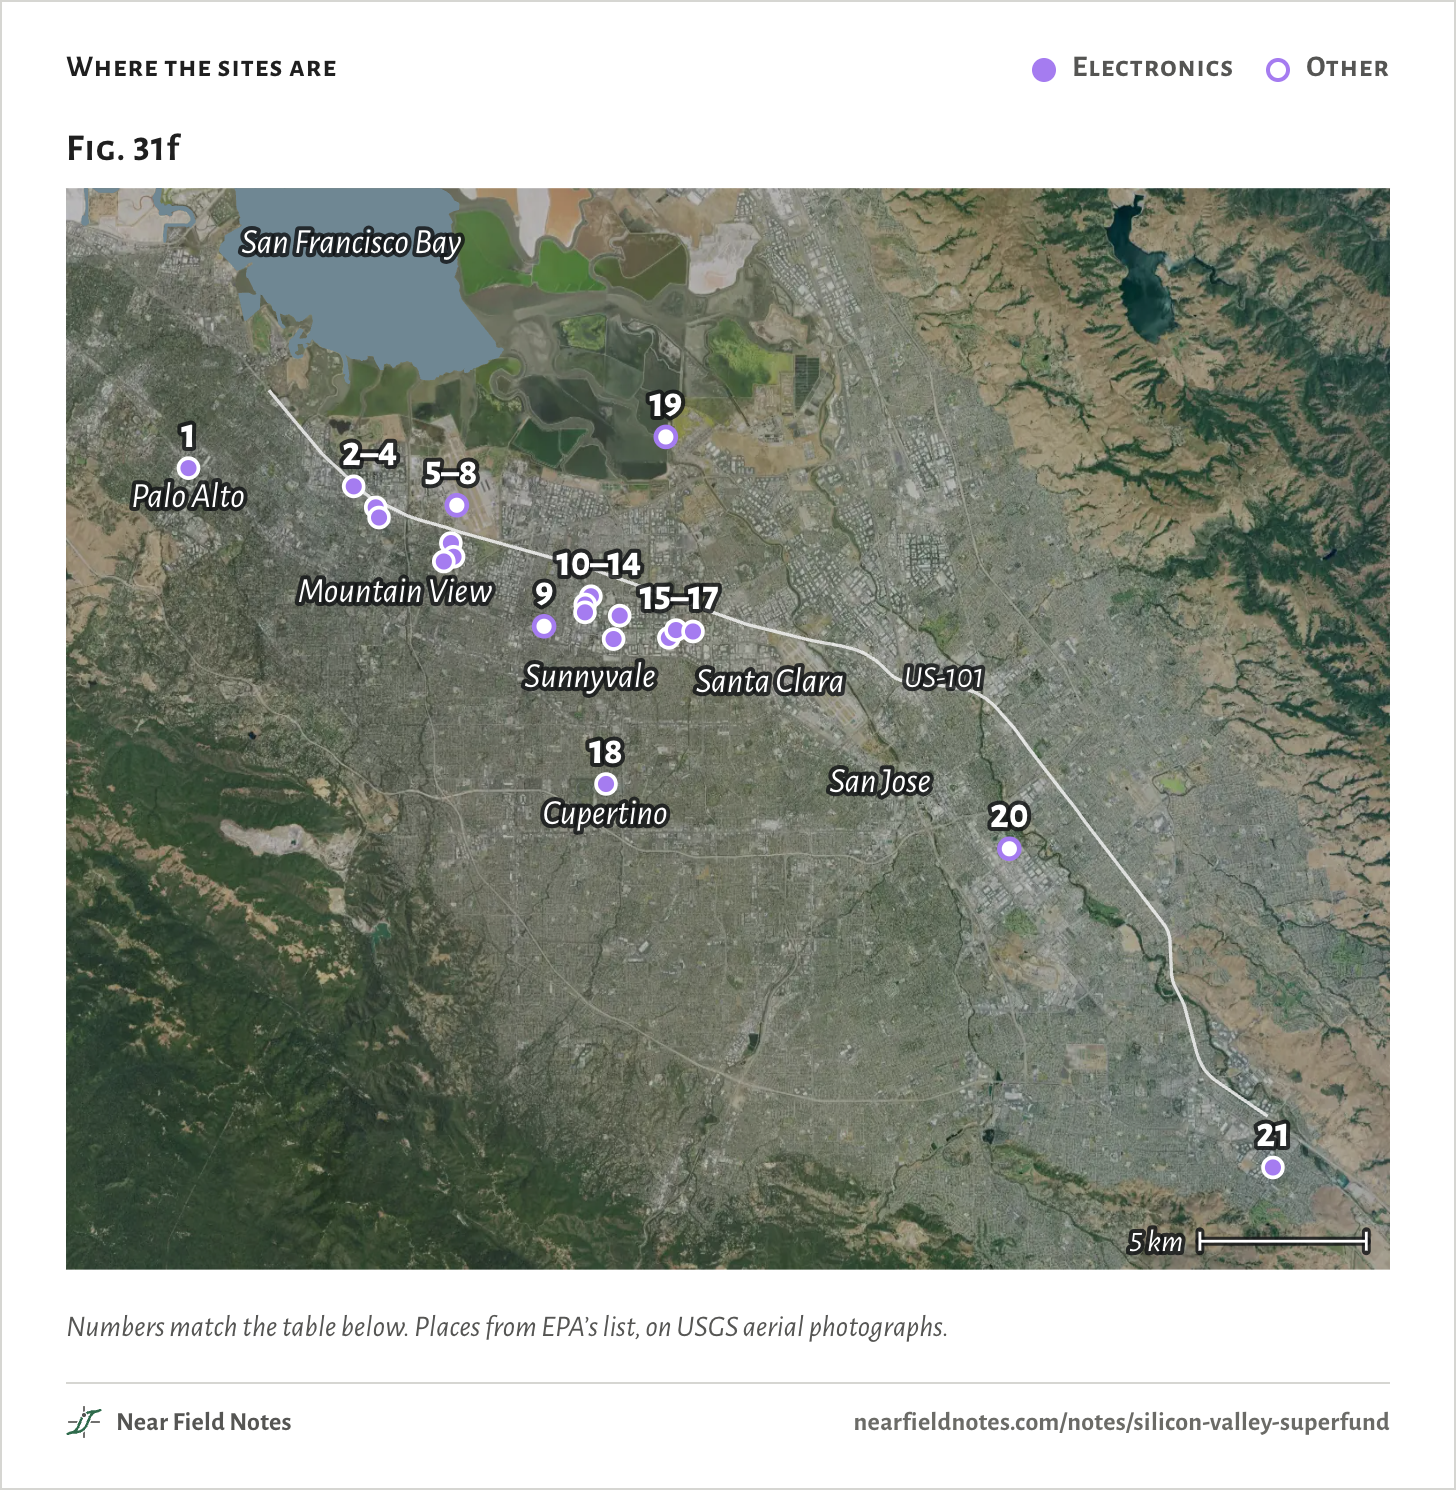
The list holds 21 sites today, and most of them follow US-101 from Palo Alto to Santa Clara. Electronics factories account for 17, most of them chip plants. The other 4 are a Navy air station, a transformer plant, a drum recycler and a group of asbestos landfills.
Los Angeles County is next with 18. The count says how many sites EPA has listed. It is not a measure of how polluted a place is.
Where the sites are
Electronics
Other
Numbers match the table below. Places from EPA’s list, on USGS aerial photographs.
Each name links to EPA’s page for the site. Listed is the year the site went on the list for good. Now is from each site’s latest EPA review or record. The list once held two more sites, since deleted: Intel’s Santa Clara III plant in 2019 and JASCO Chemical in 2020.
A cleanup that cannot finish
Middlefield-Ellis-Whisman, Mountain View
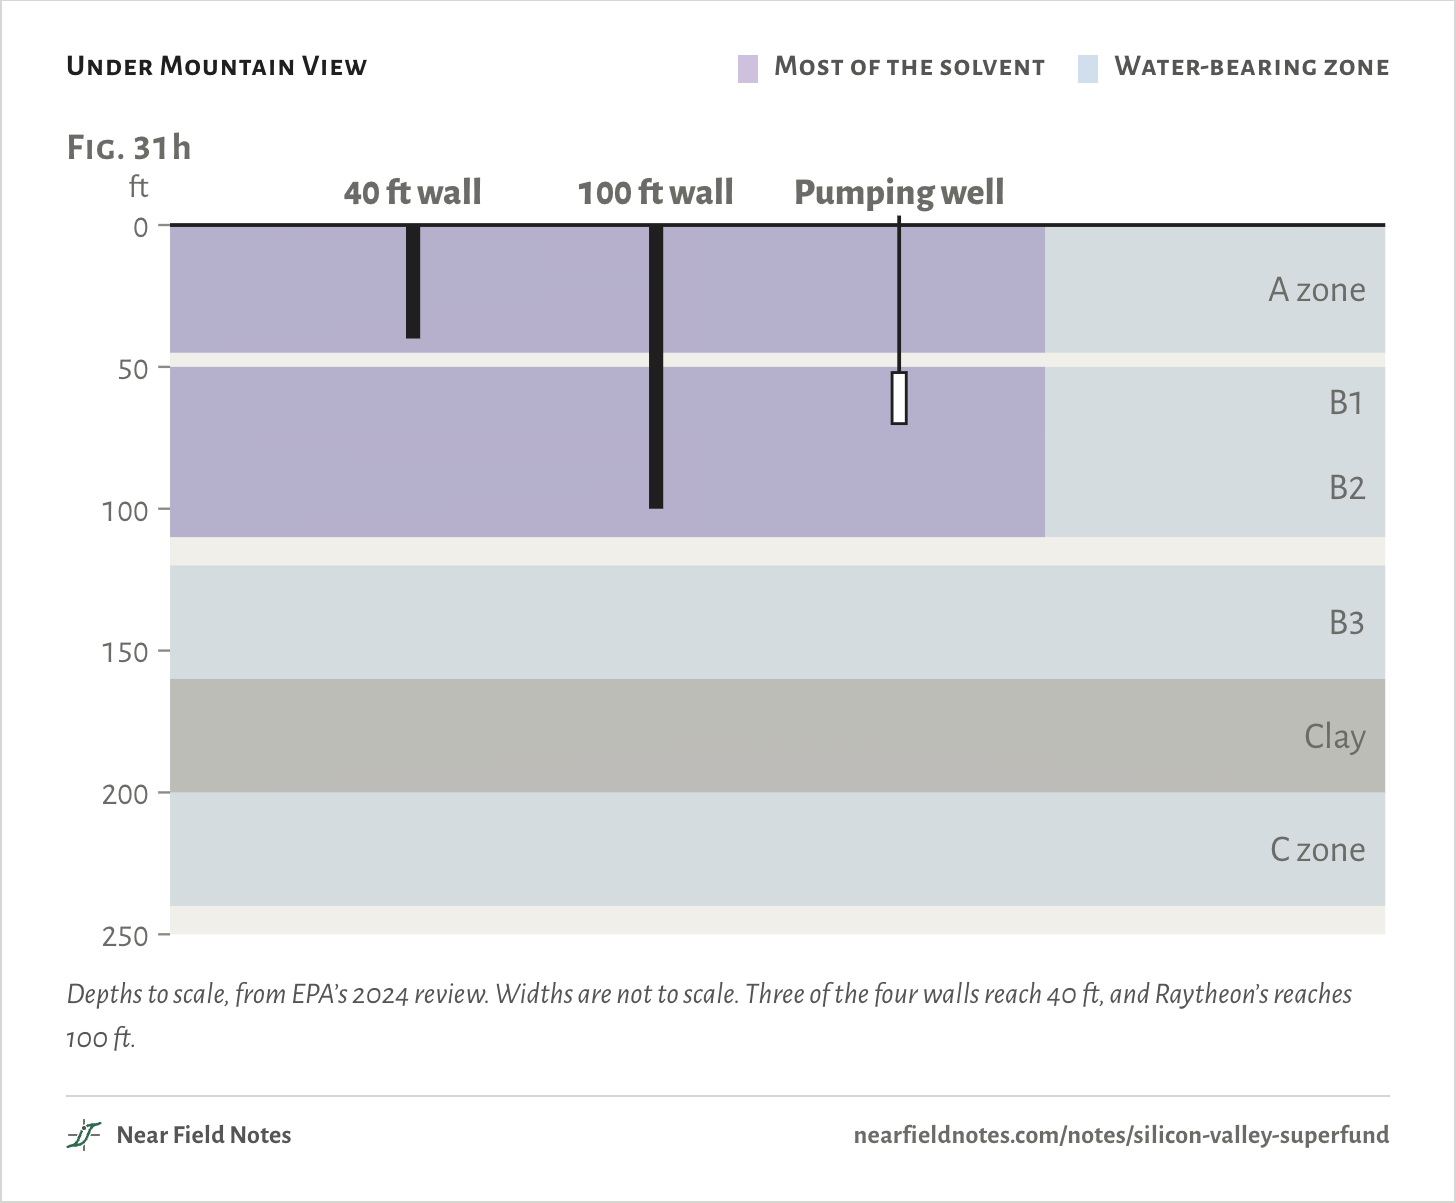
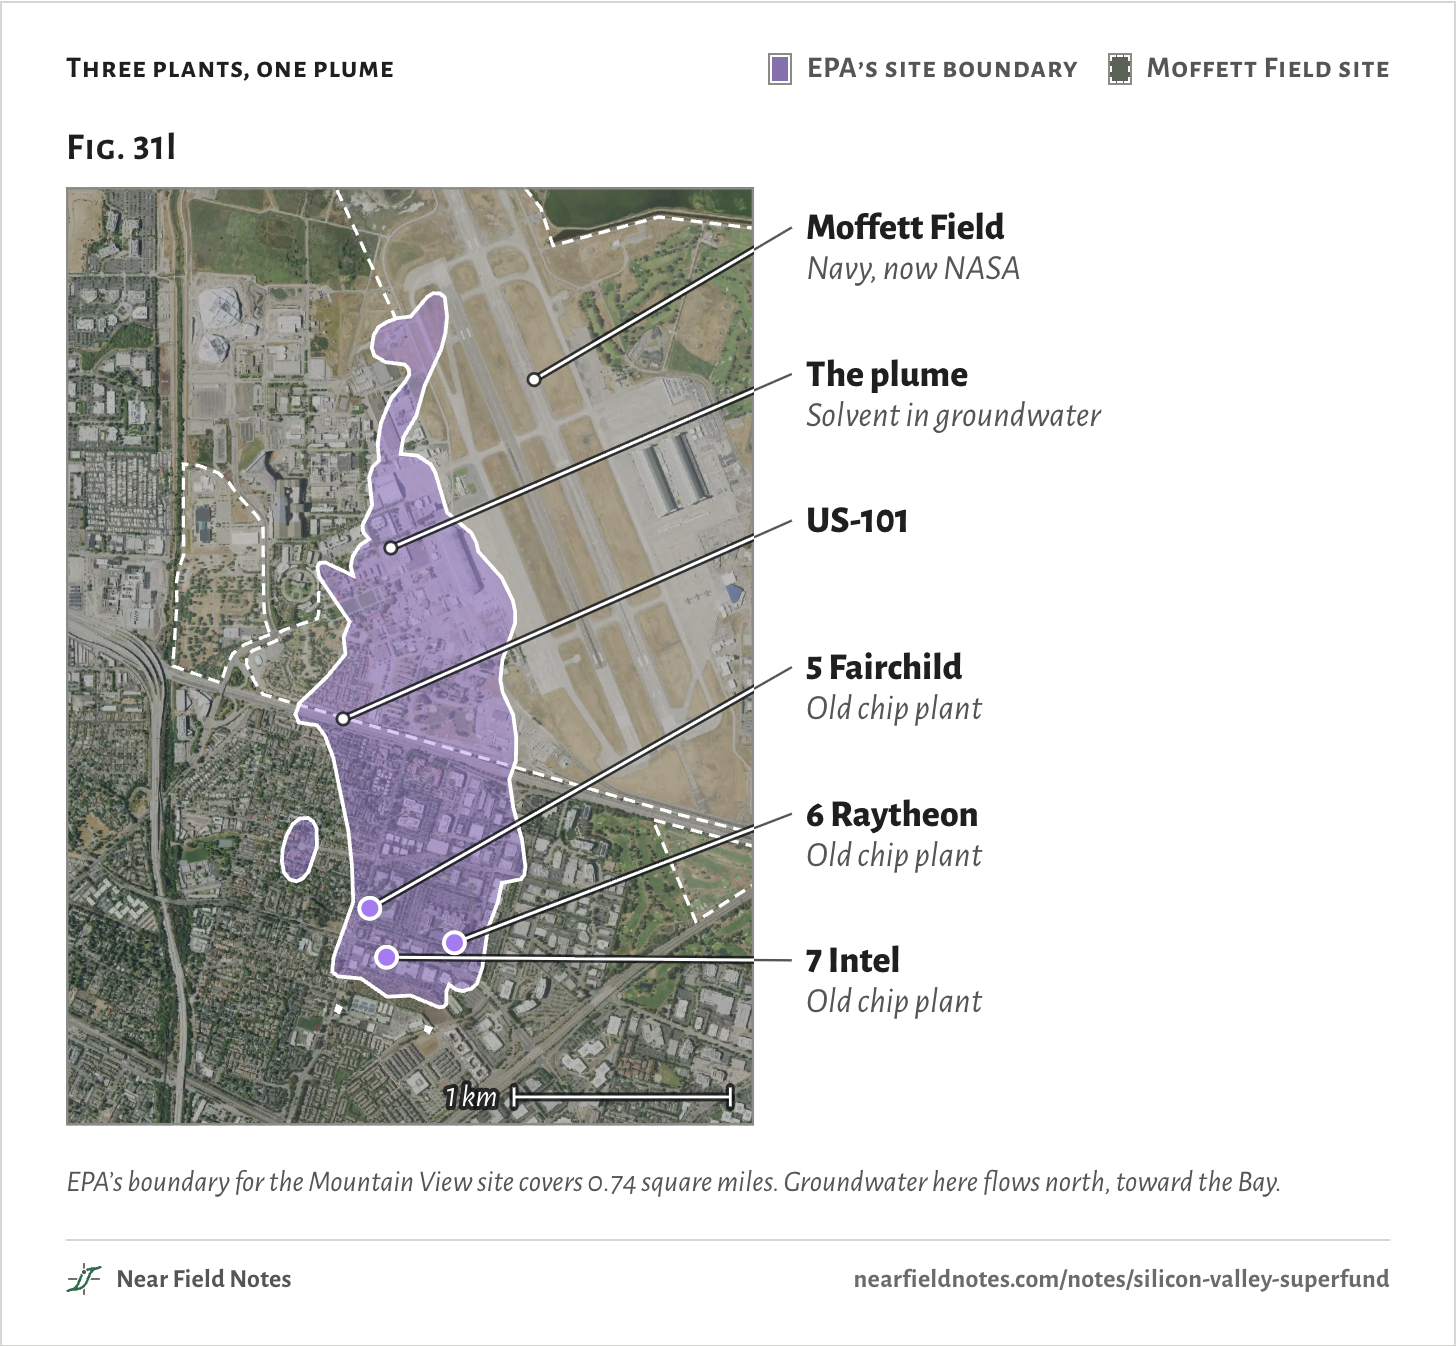
The largest cleanup is in Mountain View, where Fairchild, Raytheon and Intel ran chip plants a few blocks apart and their solvent merged into one plume. The companies dug out 36,000 cubic yards of soil, built four walls underground, and began pumping the groundwater up to clean it.
They have pumped about 8 billion gallons, enough to fill 12,000 Olympic pools, and recovered about 126,000 lb of solvent.
Under Mountain View
Most of the solvent
Water-bearing zone
Depths to scale, from EPA’s 2024 review. Widths are not to scale. Three of the four walls reach 40 ft, and Raytheon’s reaches 100 ft.
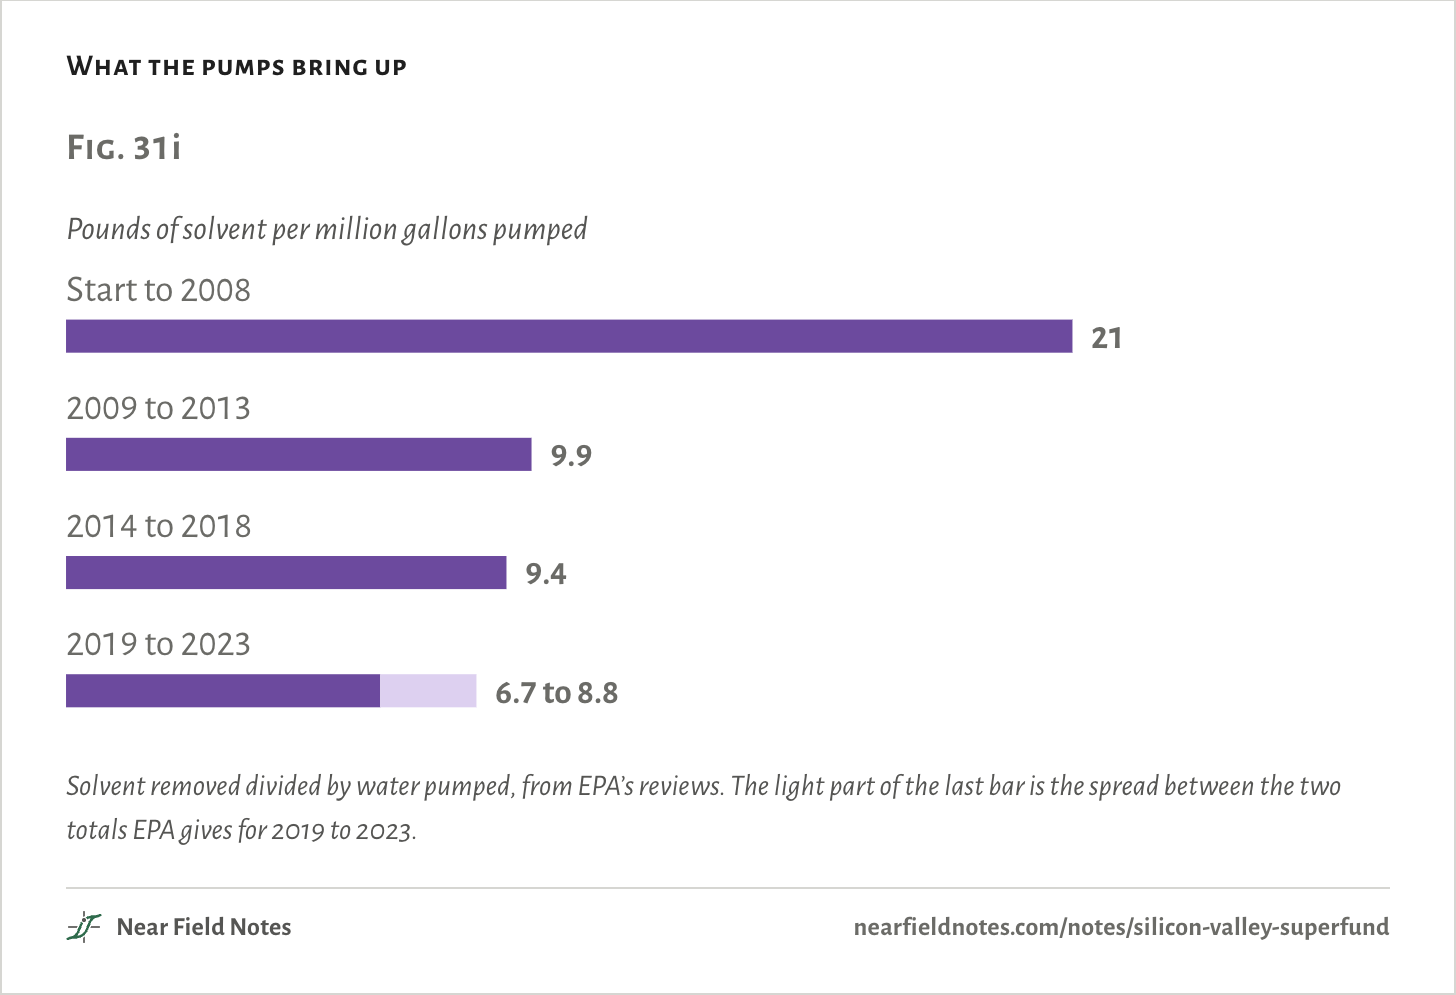
Pumping worked well at first and less well each year. TCE is heavier than water, so it sinks through sand until it meets clay. It soaks into the clay and seeps back out for decades after the sand beside it is clean.
What the pumps bring up
Solvent removed divided by water pumped, from EPA’s reviews. The light part of the last bar is the spread between the two totals EPA gives for 2019 to 2023.
316
Pump and treat
Each gallon brings up less
Field marks. Through 2008 a million gallons brought up about 21 lb of solvent. In 2024 the three main systems pumped 141 million gallons for 919 lb, about 6.5 lb per million.
Look-alike. Cleaner water at the pump is not a clean aquifer. The solvent that remains is held in clay, where pumping reaches it slowest.
Range. 89 wells feed eight treatment systems at about 424 gallons a minute. NASA has also planted more than 1,000 poplars north of the highway to draw the plume up.
Habitat. The water now carries PFAS as well. One system’s intake holds PFOS at 30 to 40 times the 2024 drinking-water limit.
317
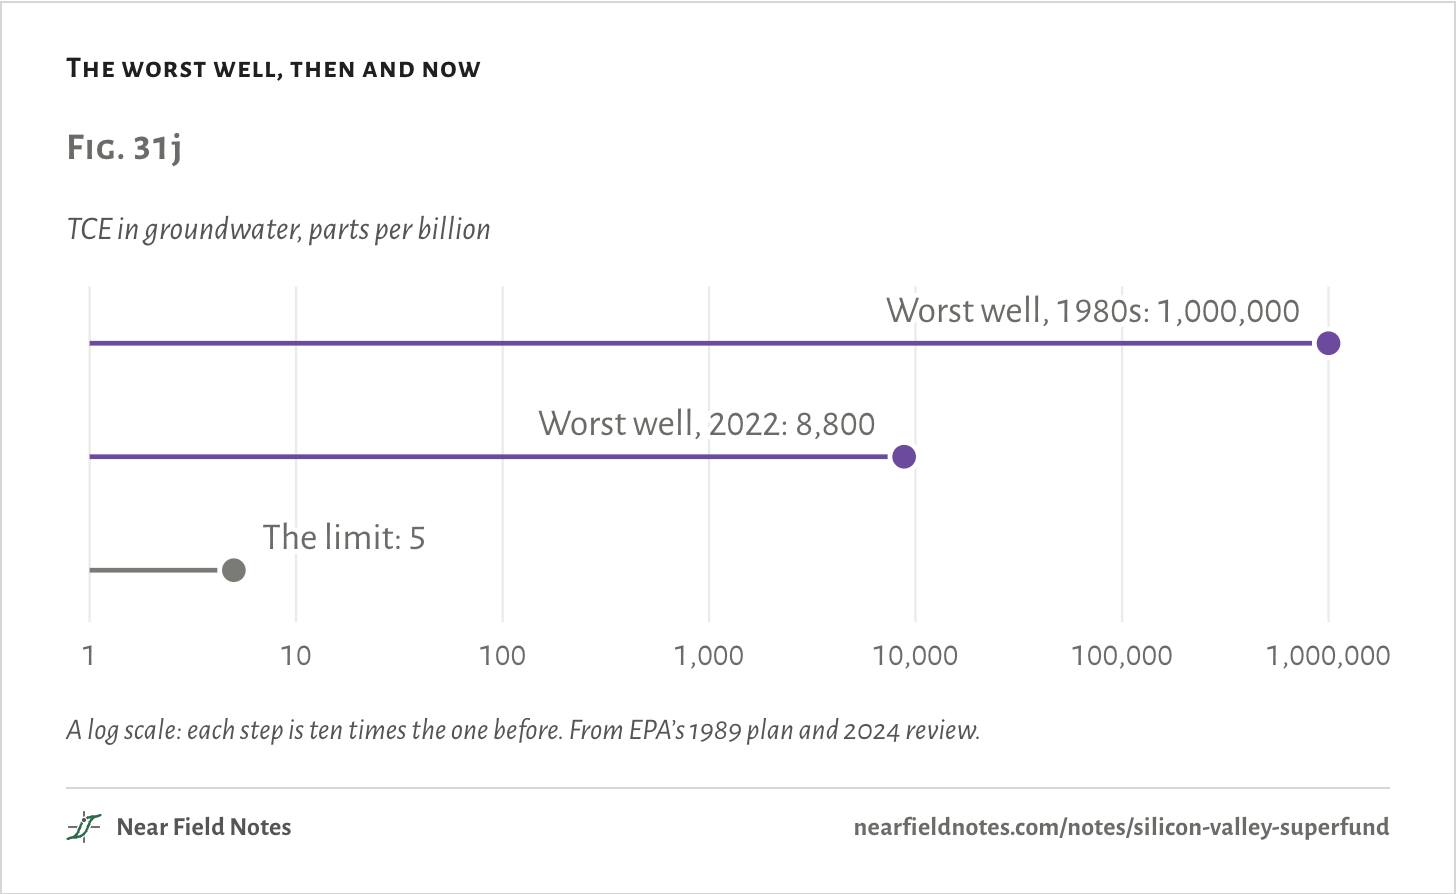
The worst well read 1,000,000 parts per billion of TCE in the 1980s, close to the most that water can dissolve. In 2022 the worst read 8,800. That is a fall of more than 99%, and it is still 1,760 times the limit.
The worst well, then and now
A log scale: each step is ten times the one before. From EPA’s 1989 plan and 2024 review.
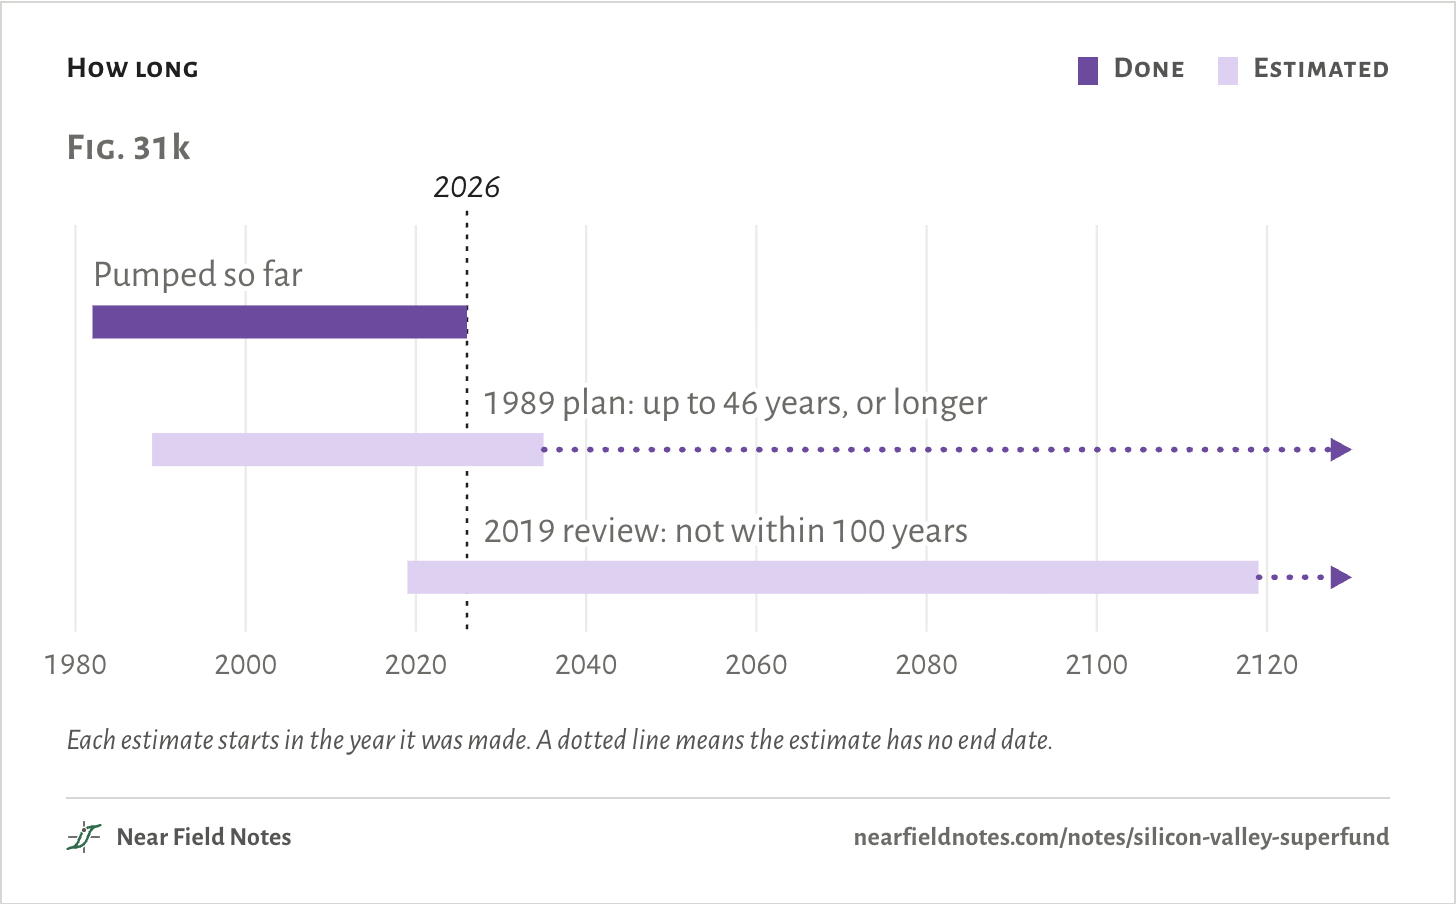
How long
Done
Estimated
Each estimate starts in the year it was made. A dotted line means the estimate has no end date.
318
The schedule
No estimate has an end date
Field marks. The 1989 plan said the shallow pumping “may be in operation for as long as 46 years or into the indefinite future.”
Look-alike. No official source says hundreds of years. EPA’s 2019 review fitted trend lines to the wells and found that the improving ones “will not reach cleanup goals within 100 years under current conditions.”
Range. In that review 11 of 18 wells sampled showed TCE that was not falling. The 2024 review says the remedy will not reach its goal “for many more decades” and calls for new methods.
Habitat. The 2024 federal ban on TCE allows cleanup sites 50 more years to dispose of the water they pump.
319
Up through the floor
Vapor intrusion
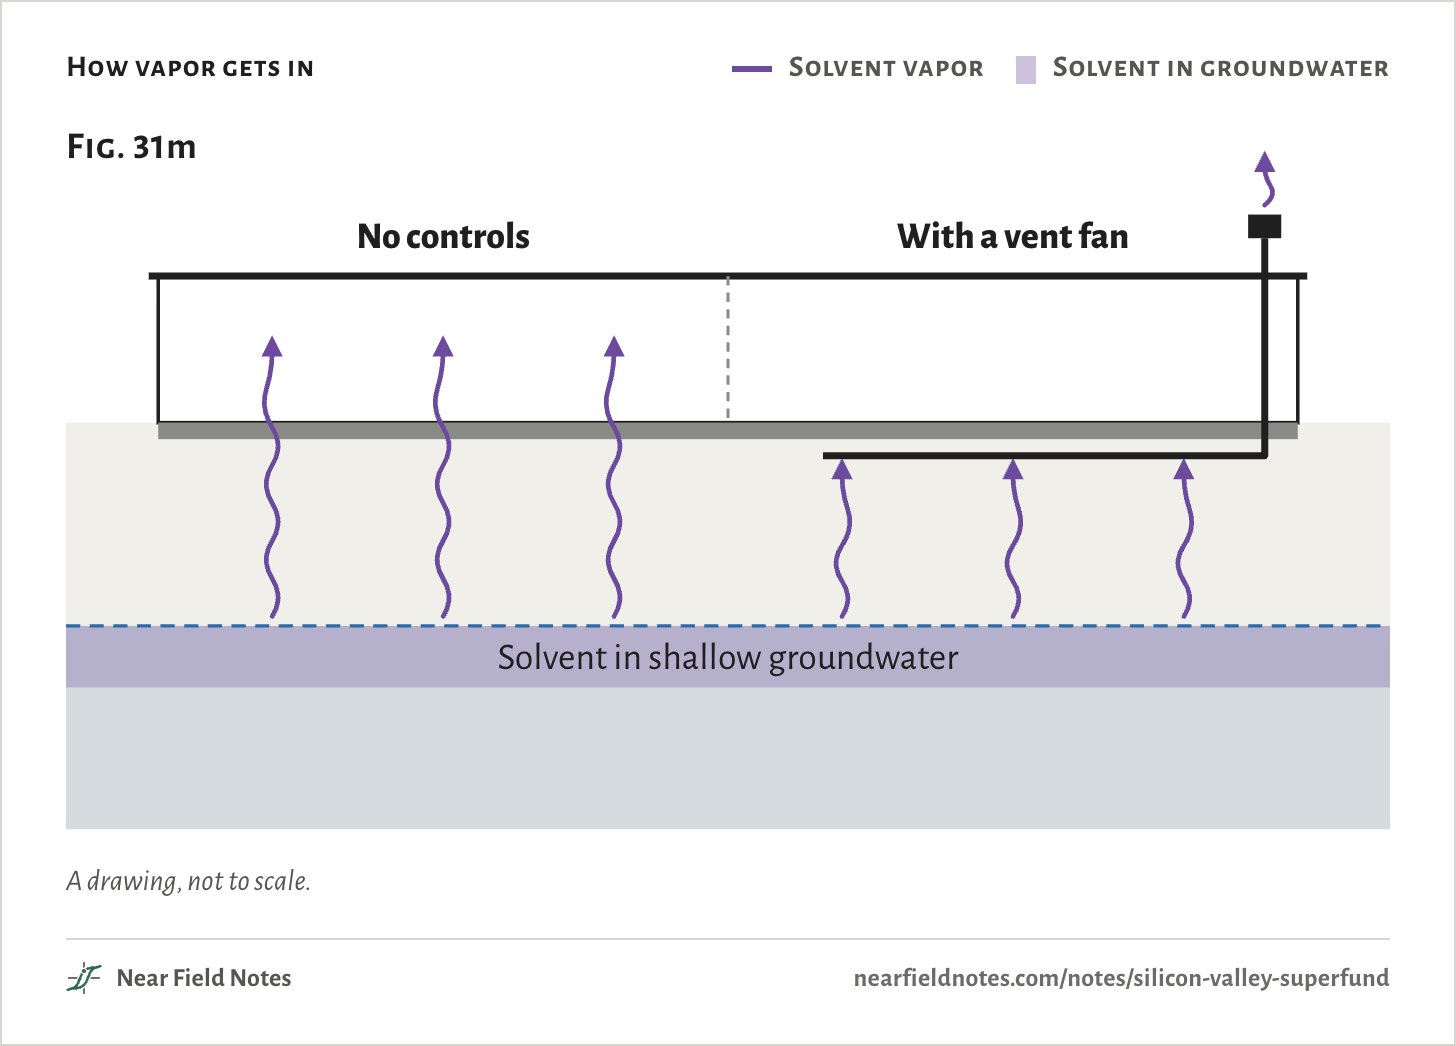
Solvent in shallow groundwater also evaporates. The vapor rises through the soil and into whatever stands on top, through cracks and pipe openings in the floor slab. In Mountain View it comes from the top 5 to 35 ft of the plume. The usual fix is a fan that pulls the vapor from under the slab and vents it above the roof.
How vapor gets in
Solvent vapor
Solvent in groundwater
A drawing, not to scale.
Three plants, one plume
EPA’s site boundary
Moffett Field site
EPA’s boundary for the Mountain View site covers 0.74 square miles. Groundwater here flows north, toward the Bay.
320
What stands on top
Offices, homes and schools now sit over the plumes
Field marks. In November 2012, after a change to the ventilation in two Google buildings on Fairchild’s old plant, TCE in the indoor air rose above EPA’s level for offices. Fans under the slabs have run since 2014.
Look-alike. Google’s campus there stood unoccupied in 2025. In March 2026 OpenAI leased the old Raytheon plant next door, which sits inside the 100 ft underground wall.
Range. In Sunnyvale, AMD’s Building 915 is now about 450 townhomes, with a vapor barrier and vents under every building. Nearby, one plume lies under more than 500 homes and three school campuses. In Cupertino, Apple has offices on the old Intersil lot, across Tantau Avenue from Apple Park.
Habitat. The South San Jose plant that leaked in 1981 is a shopping center.
321
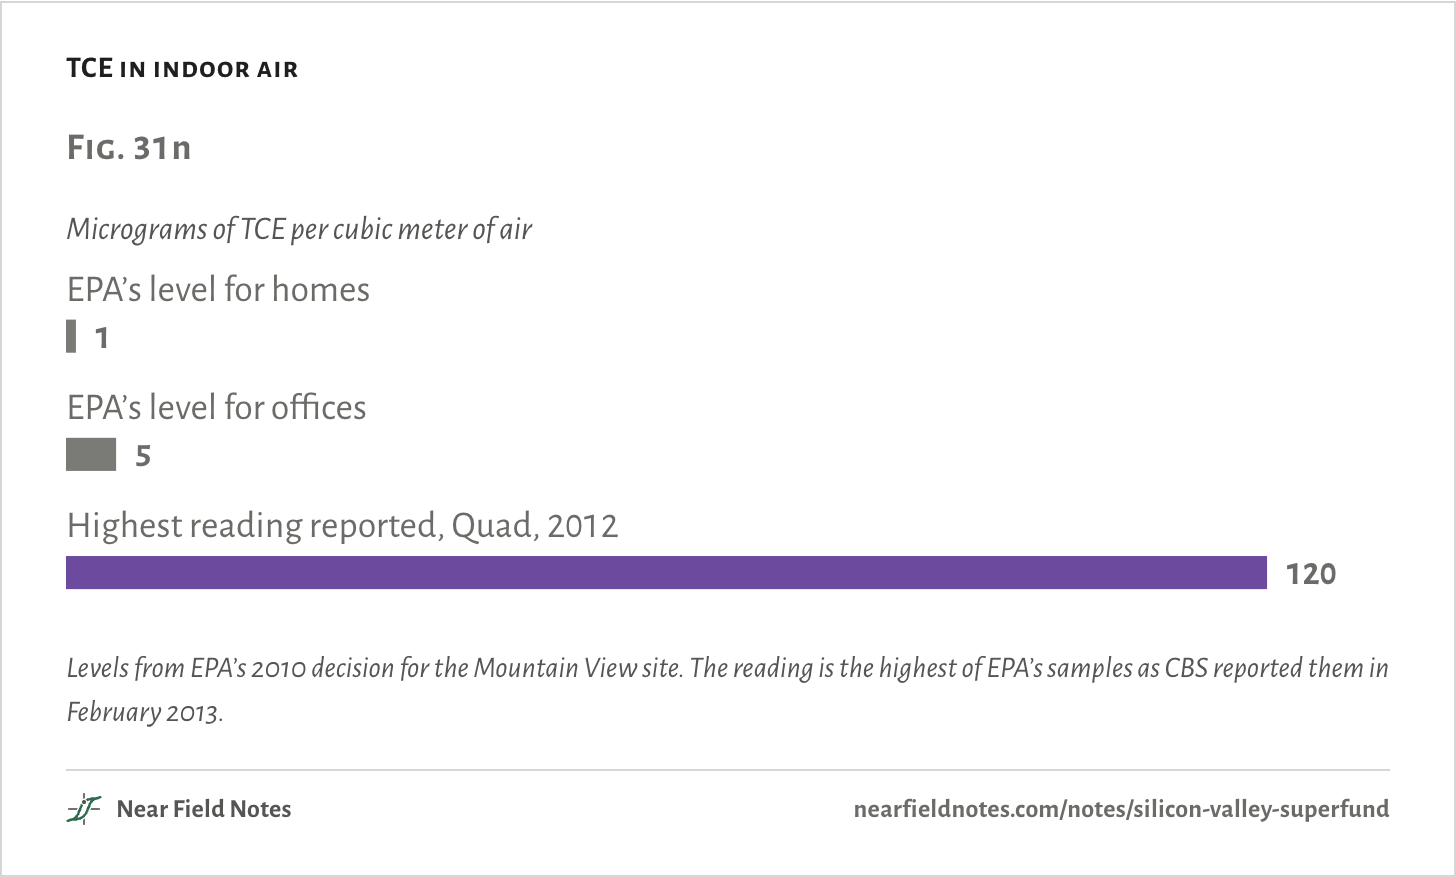
EPA treats TCE vapor as urgent because of one short-term risk: heart defects, which can form in about three weeks early in a pregnancy. Its regional office asks for a fix within weeks when a home reads 2 micrograms per cubic meter, and within days at 6. For an eight-hour workday the levels are 8 and 24.
The long-term levels in Mountain View are lower still: 1 for homes and 5 for offices. News reports of EPA’s 2012 samples in the Google buildings put most stations under 5, about a dozen between 5 and 30, and one at 120.
TCE in indoor air
Levels from EPA’s 2010 decision for the Mountain View site. The reading is the highest of EPA’s samples as CBS reported them in February 2013.
Ten thousand wells
Santa Clara County, 2026
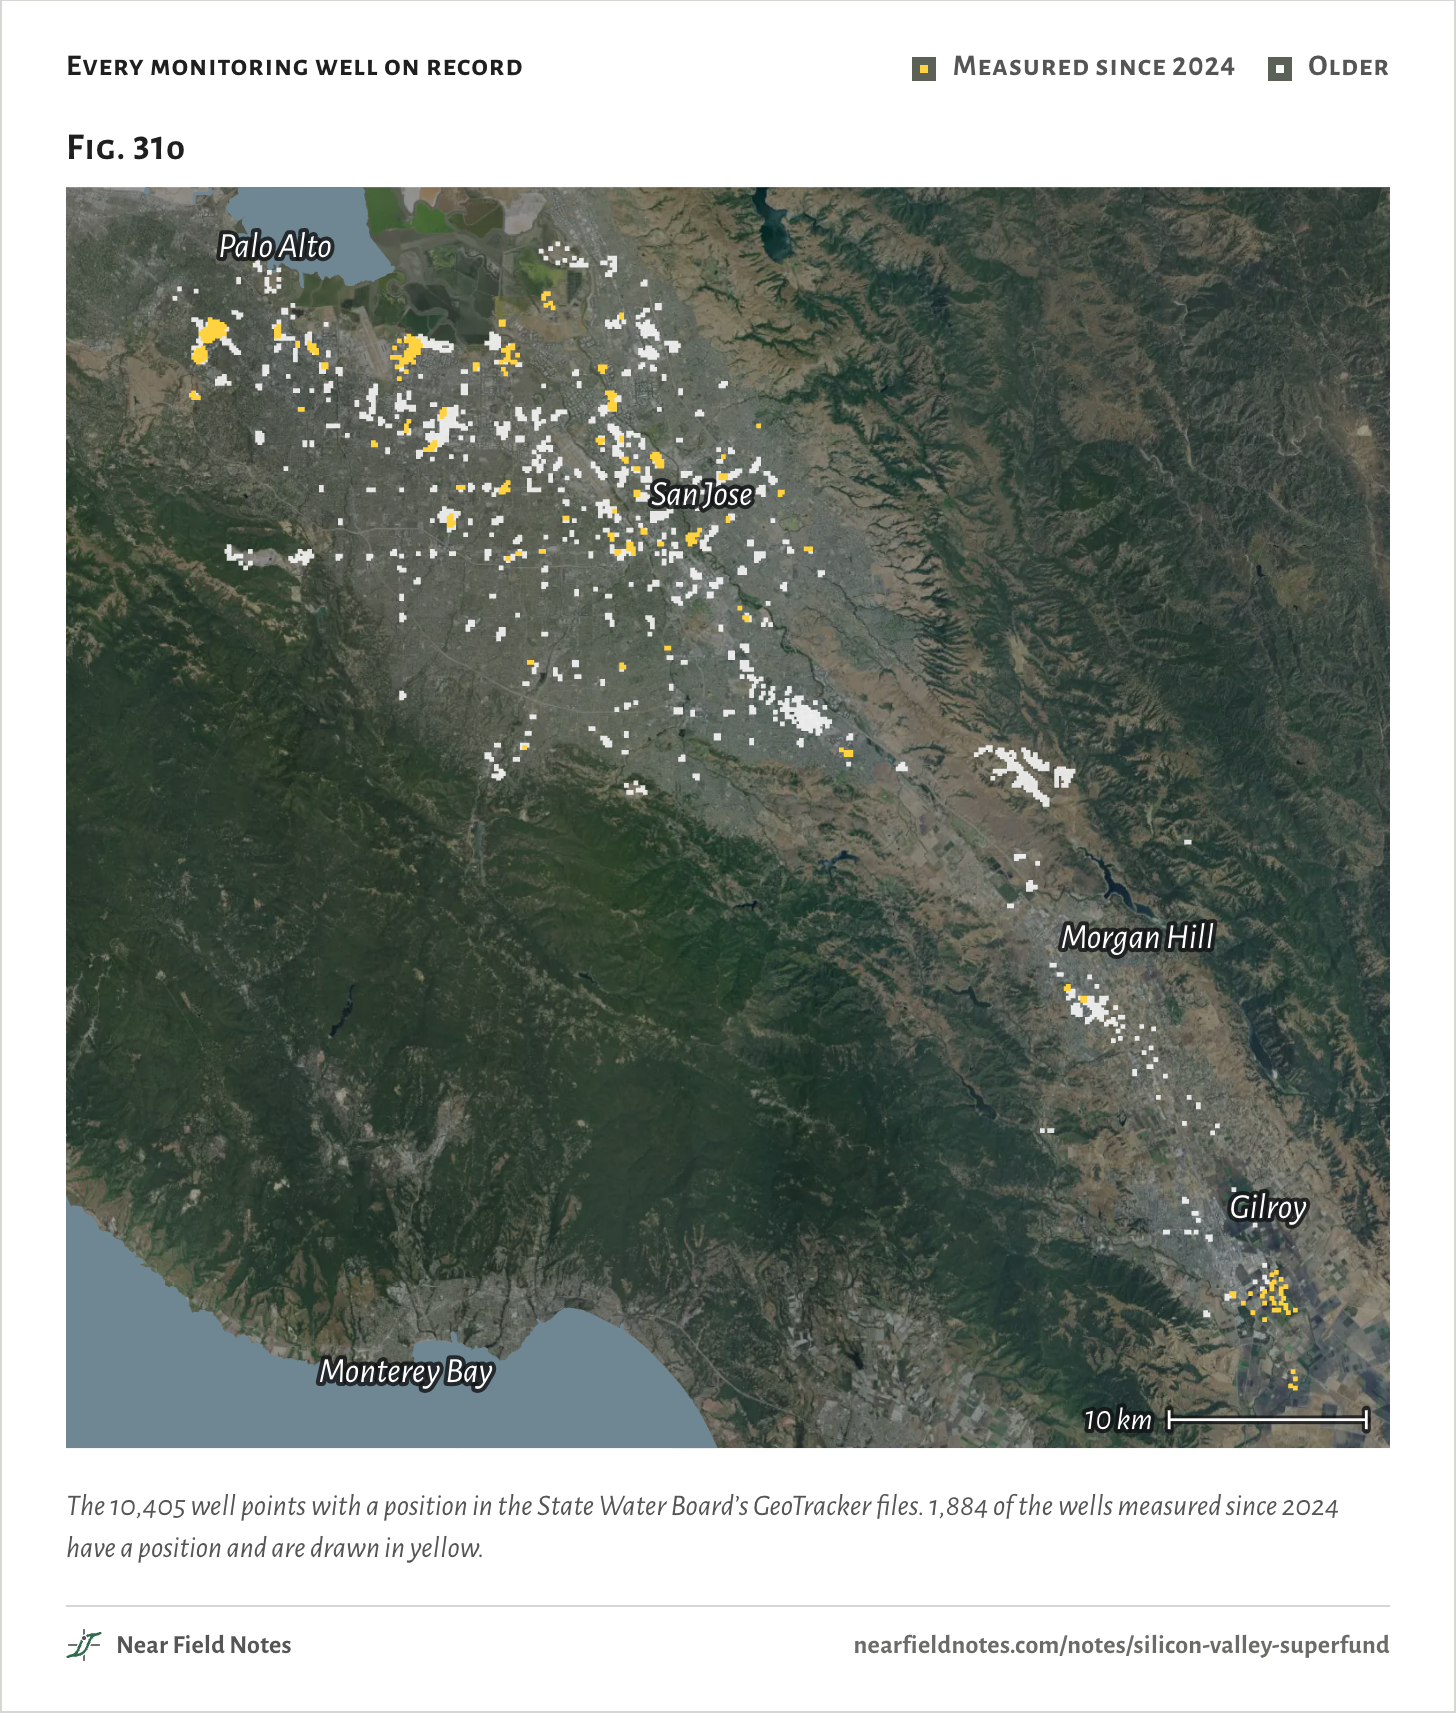
All of it is watched through wells. The state’s records hold 10,002 monitoring wells in Santa Clara County, and 2,406 had a water level measured in 2024 or later. EPA’s own sites keep hundreds more that the state’s files leave out.
The companies still pay. Fairchild’s share goes to Schlumberger, an oilfield-services company that bought Fairchild in 1979, sold it in 1987 and kept the cleanup. Raytheon’s goes to RTX and National Semiconductor’s to Texas Instruments. Intel pays its own, and the Navy and NASA pay for Moffett Field.
The tap water is a separate matter. Nobody drinks the shallow groundwater. EPA’s 2024 review says drinking water in Mountain View comes from the Hetch Hetchy reservoir and local sources, and is treated to meet state and federal standards. A thick layer of clay lies between the shallow plumes and the deep aquifers that supply wells.
Every monitoring well on record
Measured since 2024
Older
The 10,405 well points with a position in the State Water Board’s GeoTracker files. 1,884 of the wells measured since 2024 have a position and are drawn in yellow.
Is there a site near you?
Anywhere in the United States
Santa Clara County has the most listed sites, and it is not the only place with them. EPA and the states publish where every site is, and the records are free to search.
The story in dates
1956Shockley’s lab opens in a fruit-packing shed in Mountain View
1957Fairchild Semiconductor starts
1968Intel starts, with a plant in Mountain View
1971A trade paper names the place Silicon Valley
1980IBM reports a solvent leak in South San Jose
1981Fairchild’s tank leak is found, and well GO-13 is shut
1983The county’s storage ordinance and California’s tank law
1984EPA proposes 19 South Bay sites in one day
1989The Mountain View plan: 46 years, or the indefinite future
2012TCE vapor is found in Google’s buildings
2019EPA’s review: not within 100 years
2024EPA issues a ban on TCE. Parts of it have since been delayed.
1bThe state’s cleanup map. In California it is GeoTrackerState cases and their wells
1cYour water supplier’s yearly quality reportWhat is in the tap water
Each Superfund site’s page lists its five-year reviews. A review says what was found, what is being done, and who is paying.
323
Conditions
The count
Sites with the status “NPL Site” in EPA’s National Priorities List layer, as edited on 30 September 2026 and counted on 9 November 2026. A site that spans two counties counts in each.
Electronics
A site counts as electronics if a maker of chips, circuit boards, lasers, microwave parts or chip equipment ran it, by EPA’s listing.
Then and now
From each site’s EPA listing and its latest five-year review or record, read in November 2026
The leak
EPA’s 2024 review of the South San Jose site and the National Research Council’s 1988 report
Mountain View
EPA’s 1989 plan and its 2014, 2019 and 2024 reviews. The total pumped through 2023 is 8.0 to 8.3 billion gallons, because the 2024 review gives two totals for 2019 to 2023.
Wells
State Water Board GeoTracker files for the county, built on 8 November 2026
Units
In water, 1 part per billion is 1 microgram per liter. An Olympic pool is taken as 660,000 gallons.
Maps
Aerial photographs from the USGS base map, as served in November 2026, with the Bay and the ocean drawn from the USGS National Hydrography Dataset. Site boundaries from EPA, US-101 from OpenStreetMap, and the USGS Palo Alto sheet of 1948 and San Jose sheet of 1953, both at 1:62,500.
Sourced, not measured. Every number here comes from a public record, and nothing was simulated.
Limits
A count of listed sites is not a ranking of pollution. It also reflects how closely a place was studied in the 1980s.
The 60,000 gallons is solvent and water together. No source gives the solvent alone with confidence.
The state’s studies found that the cluster of birth defects was real and that the leak was unlikely to be its cause. They did not find another cause.
The 120 reading in the Google buildings is from a news report of EPA’s samples. EPA’s own record says only that readings were above its level for offices.
The fire-code reason for burying the tanks rests on one historian’s account and one news report.
What stands on a site can change. The table’s Now column is as of November 2026.
The state’s files leave out most wells at the sites EPA leads, so the county’s true count is higher.
Files
refs/sc_npl_sites.csvEvery site, with its EPA number, dates and links
refs/sites_now.csvWhat stands on each site, with its source
refs/npl_county_ranking.csvThe count for every county
data/note_facts.jsonEach number the figures draw, with its source