Near Field Notes

Note 6EMCRev 1Watch the video · 1:19

Spread spectrum

What does spread spectrum do to a buck’s EMI test?

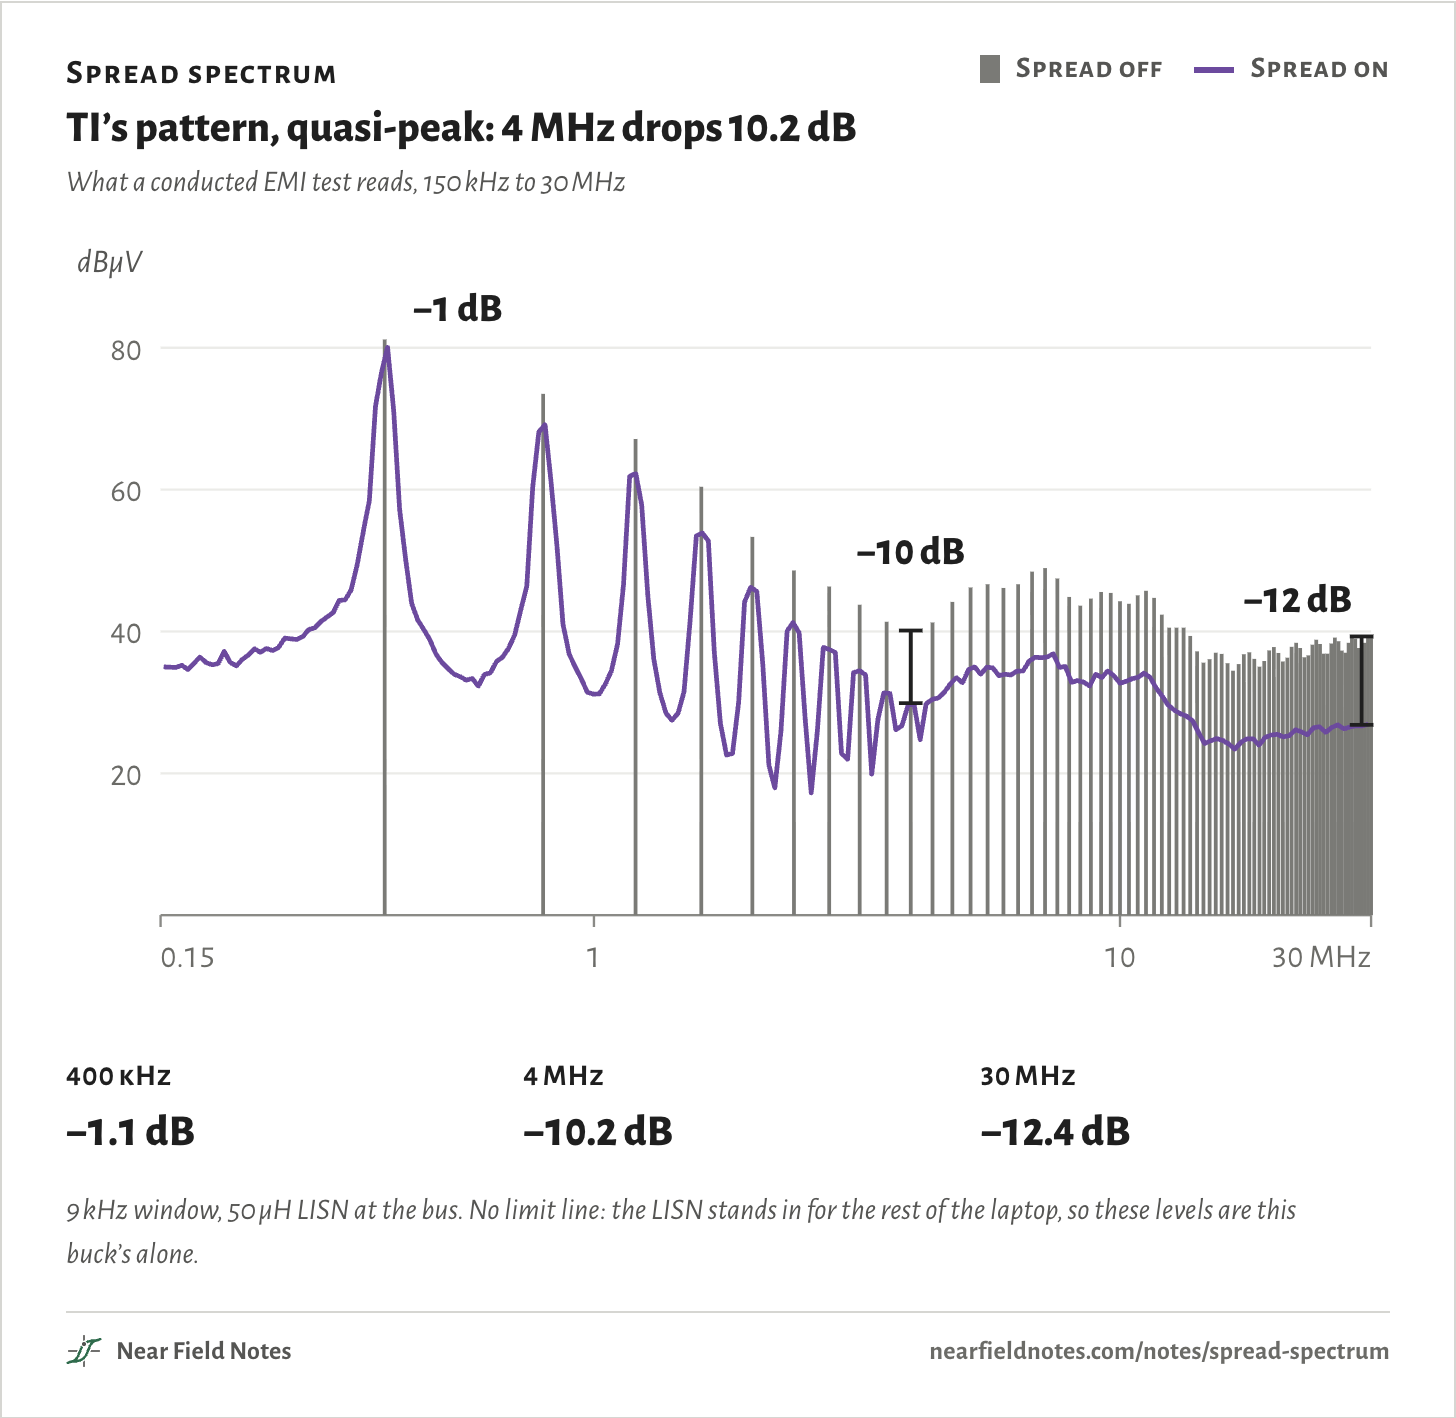
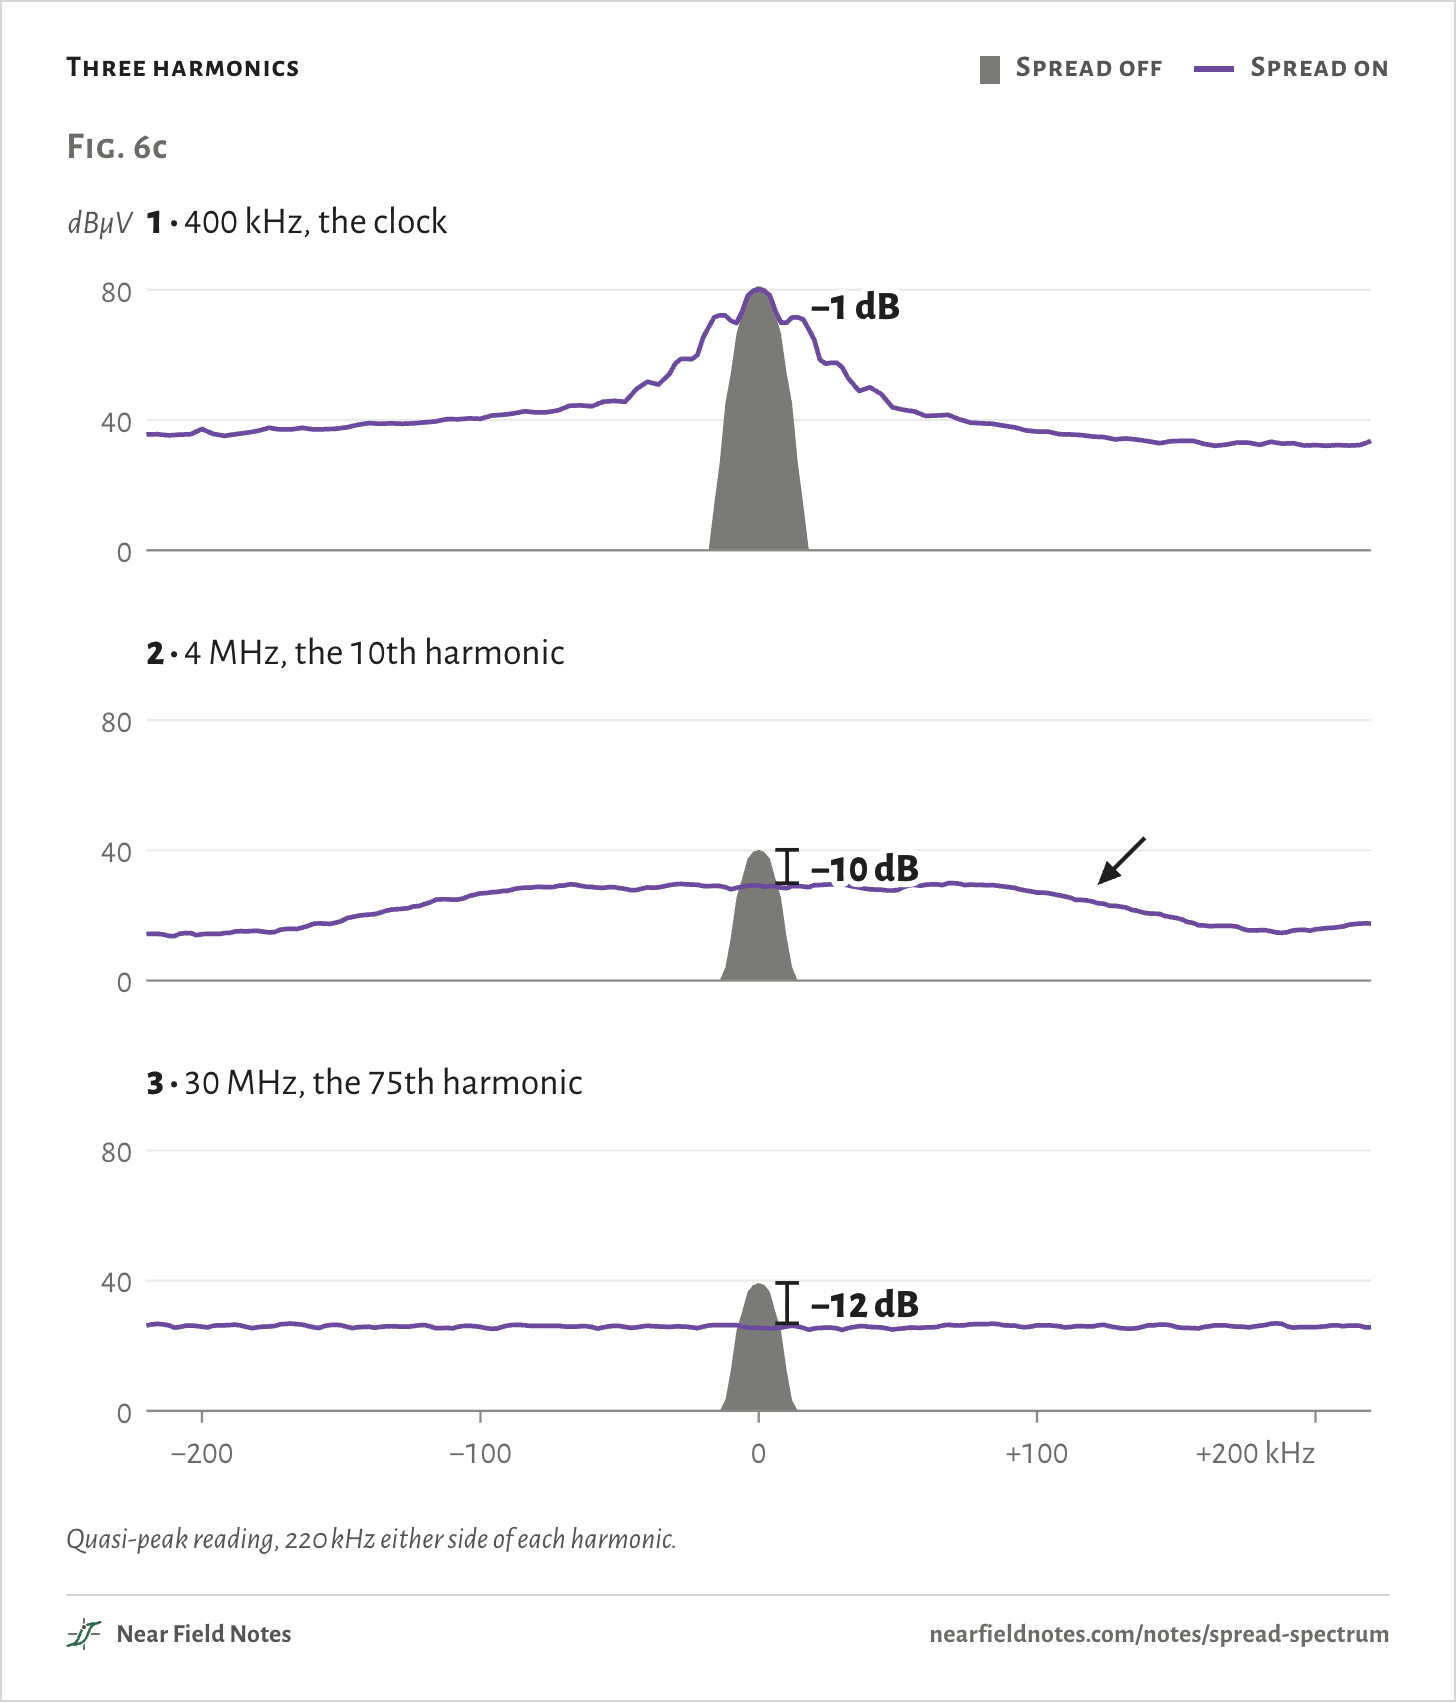
Almost nothing at its 400 kHz clock. It takes 10 dB off the 4 MHz reading and 12 dB off 30 MHz.

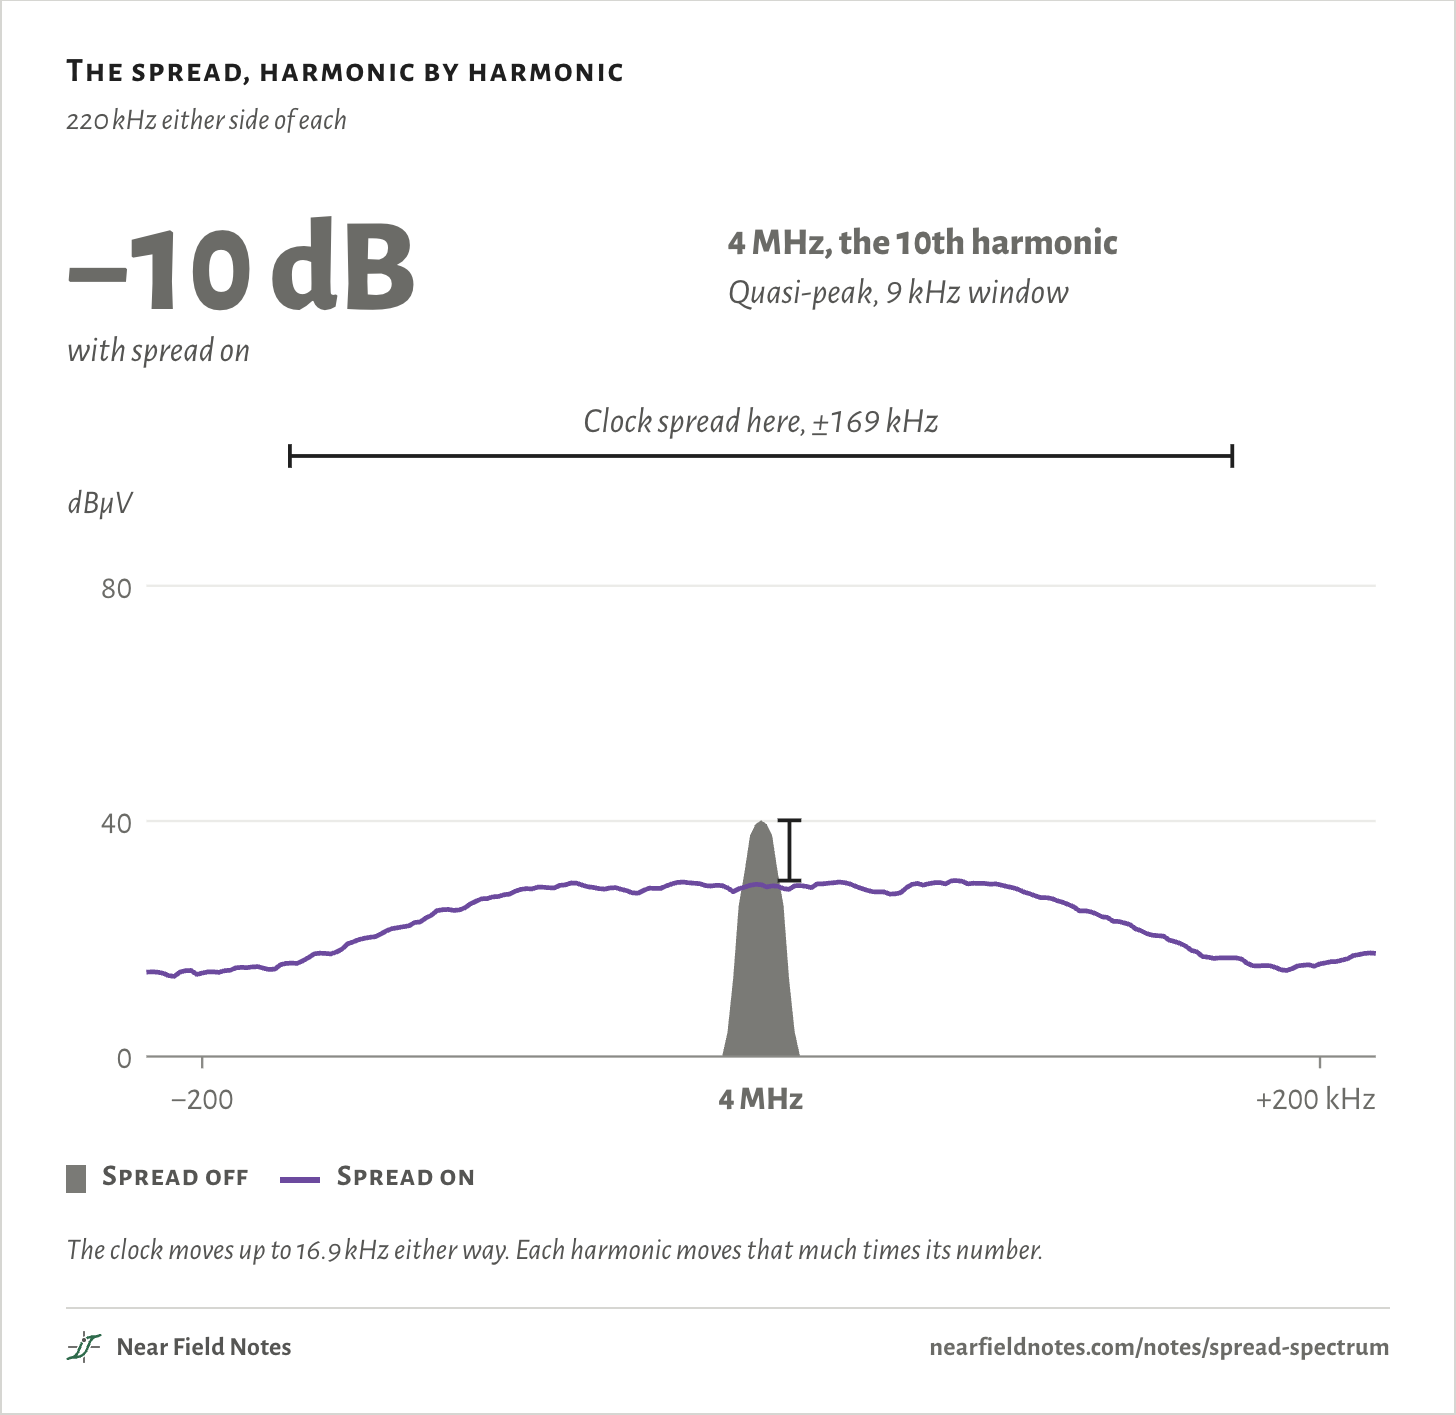
The spread, harmonic by harmonic

220 kHz either side of each

Quasi-peak, 9 kHz windowwith spread on40800dBµV−1 dB400 kHzClock spread here, ±16.9 kHz400 kHz−10 dB4 MHzClock spread here, ±169 kHz4 MHz−12 dB30 MHzClock spread here, ±1.3 MHz30 MHz−200+200 kHzQuasi-peak, 9 kHz windowwith spread on40800dBµV−1 dB400 kHz, the clockClock spread here, ±16.9 kHz400 kHz−10 dB4 MHz, the 10th harmonicClock spread here, ±169 kHz4 MHz−12 dB30 MHz, the 75th harmonicClock spread here, ±1.3 MHz30 MHz−200+200 kHzQuasi-peak, 9 kHz windowwith spread on40800dBµV−1 dB400 kHz, the clockClock spread here, ±16.9 kHz400 kHz−10 dB4 MHz, the 10th harmonicClock spread here, ±169 kHz4 MHz−12 dB30 MHz, the 75th harmonicClock spread here, ±1.3 MHz30 MHz−200+200 kHz
  • Spread off
  • Spread on

The clock moves up to 16.9 kHz either way. Each harmonic moves that much times its number.

The buck and its test

MNT Reform’s 5 V rail

The MNT Reform laptop makes its 5 V with an LM62460 buck. It pulls its input current from the bus in pulses, 400,000 a second, and that current is the noise a conducted EMI test reads. With spread spectrum on, the chip moves its clock a little every cycle.

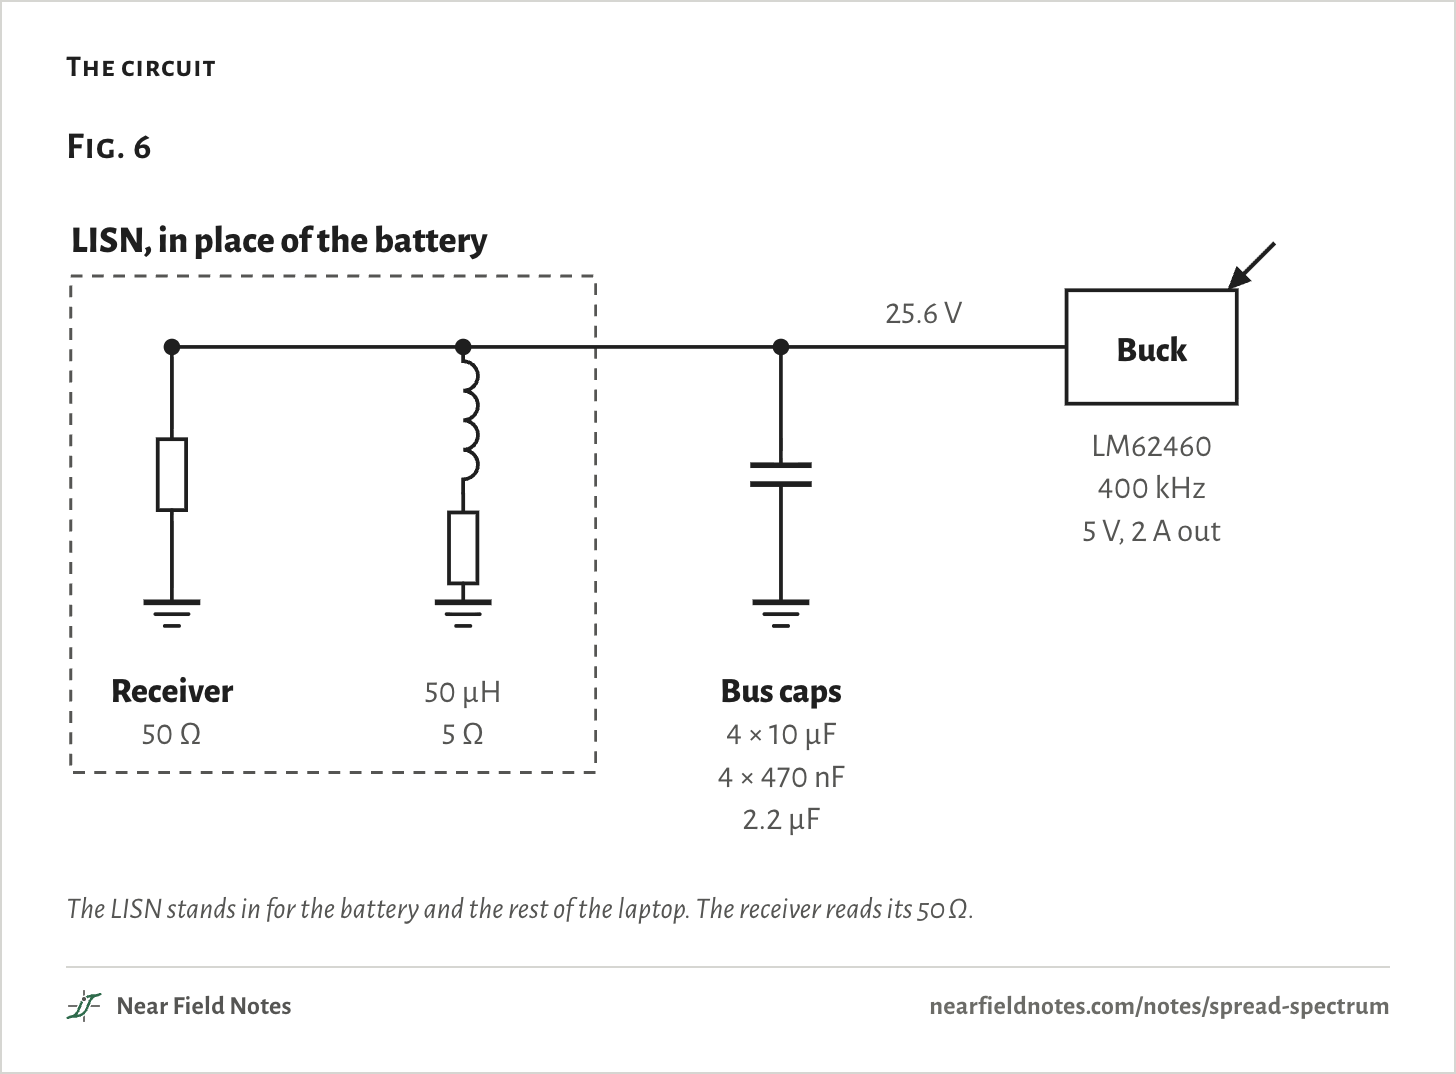
The circuit
Fig. 6LISNReceiver50 Ω50 µH5 ΩBus caps4 × 10 µF4 × 470 nF2.2 µFBuckLM62460400 kHz5 V, 2 A out25.6 VFig. 6LISN, in place of the batteryReceiver50 Ω50 µH5 ΩBus caps4 × 10 µF4 × 470 nF2.2 µFBuckLM62460400 kHz5 V, 2 A out25.6 VFig. 6LISN, in place of the batteryReceiver50 Ω50 µH5 ΩBus caps4 × 10 µF4 × 470 nF2.2 µFBuckLM62460400 kHz5 V, 2 A out25.6 V

The LISN stands in for the battery and the rest of the laptop. The receiver reads its 50 Ω.

The clock
  • Each cycle
  • The slow triangle
  • Spread off
Fig. 6bkHz38541540074 µs0100200300 µsFig. 6bkHz38541540074 µs0100200300 µsFig. 6bkHz38541540074 µs0100200300 µs

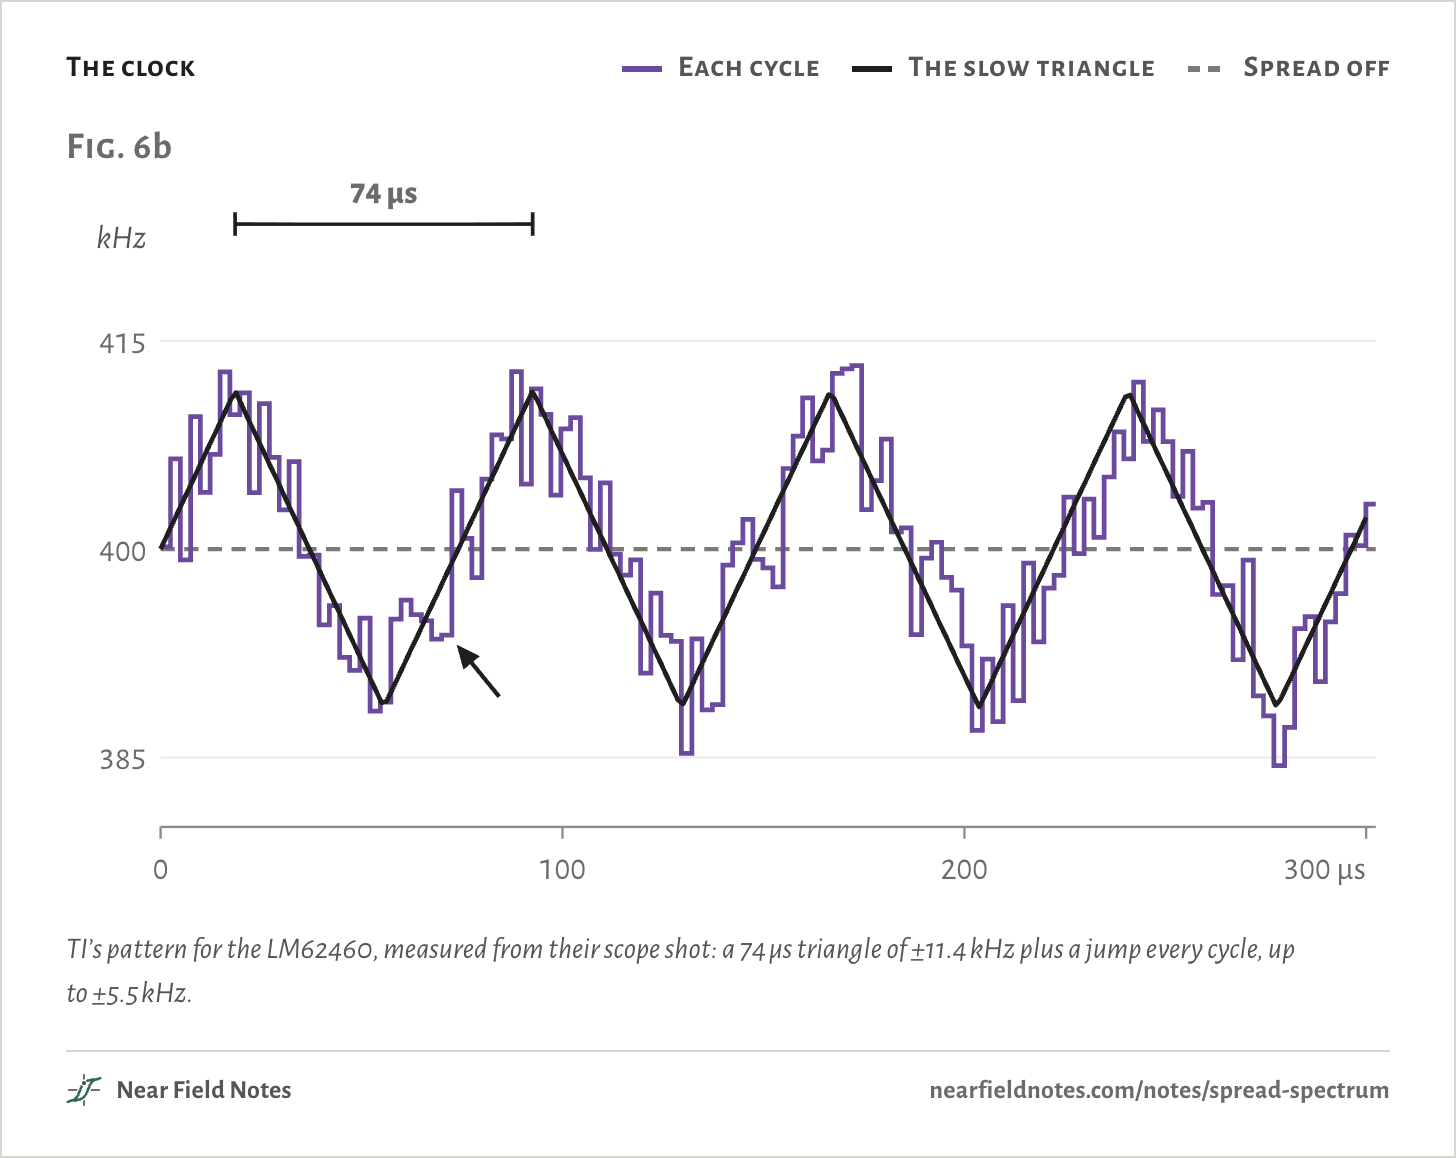
TI’s pattern for the LM62460, measured from their scope shot: a 74 µs triangle of ±11.4 kHz plus a jump every cycle, up to ±5.5 kHz.

Three harmonics
  • Spread off
  • Spread on
Fig. 6cdBµV1 · 400 kHz40800−1 dB2 · 4 MHz40800−10 dB3 · 30 MHz40800−12 dB−2000+200 kHzFig. 6cdBµV1 · 400 kHz, the clock40800−1 dB2 · 4 MHz, the 10th harmonic40800−10 dB3 · 30 MHz, the 75th harmonic40800−12 dB−200−1000+100+200 kHzFig. 6cdBµV1 · 400 kHz, the clock40800−1 dB2 · 4 MHz, the 10th harmonic40800−10 dB3 · 30 MHz, the 75th harmonic40800−12 dB−200−1000+100+200 kHz

Quasi-peak reading, 220 kHz either side of each harmonic.

144

Read the whole band

Hover for valuesTap or drag for values
Pattern
Detector
Spread spectrum

TI’s pattern, quasi-peak: 4 MHz drops 10.2 dB

What a conducted EMI test reads, 150 kHz to 30 MHz

  • Spread off
  • Spread on
dBµV204060800.151 MHz1030−1 dB−7 dB−8 dB−1 dB−10 dB−12 dB−1 dB−14 dB−18 dB−1 dB−9 dB−11 dB−1 dB−9 dB−12 dB−1 dB−9 dB−16 dBdBµV204060800.1511030 MHz−1 dB−7 dB−8 dB−1 dB−10 dB−12 dB−1 dB−14 dB−18 dB−1 dB−9 dB−11 dB−1 dB−9 dB−12 dB−1 dB−9 dB−16 dBdBµV204060800.1511030 MHz−1 dB−7 dB−8 dB−1 dB−10 dB−12 dB−1 dB−14 dB−18 dB−1 dB−9 dB−11 dB−1 dB−9 dB−12 dB−1 dB−9 dB−16 dB
400 kHz
−1.1 dB
4 MHz
−10.2 dB
30 MHz
−12.4 dB

9 kHz window, 50 µH LISN at the bus. No limit line: the LISN stands in for the rest of the laptop, so these levels are this buck’s alone.

Peak, quasi-peak and average

How much each detector’s reading drops with spread on

Fig. 6d

HarmonicPeakQuasi-peakAverage
400 kHz−0.7 dB−1.1 dB−1.2 dB
4 MHz−7.4 dB−10.2 dB−14.5 dB
30 MHz−8.0 dB−12.4 dB−18.4 dB
146

Every harmonic

Quasi-peak, 400 kHz to 30 MHz
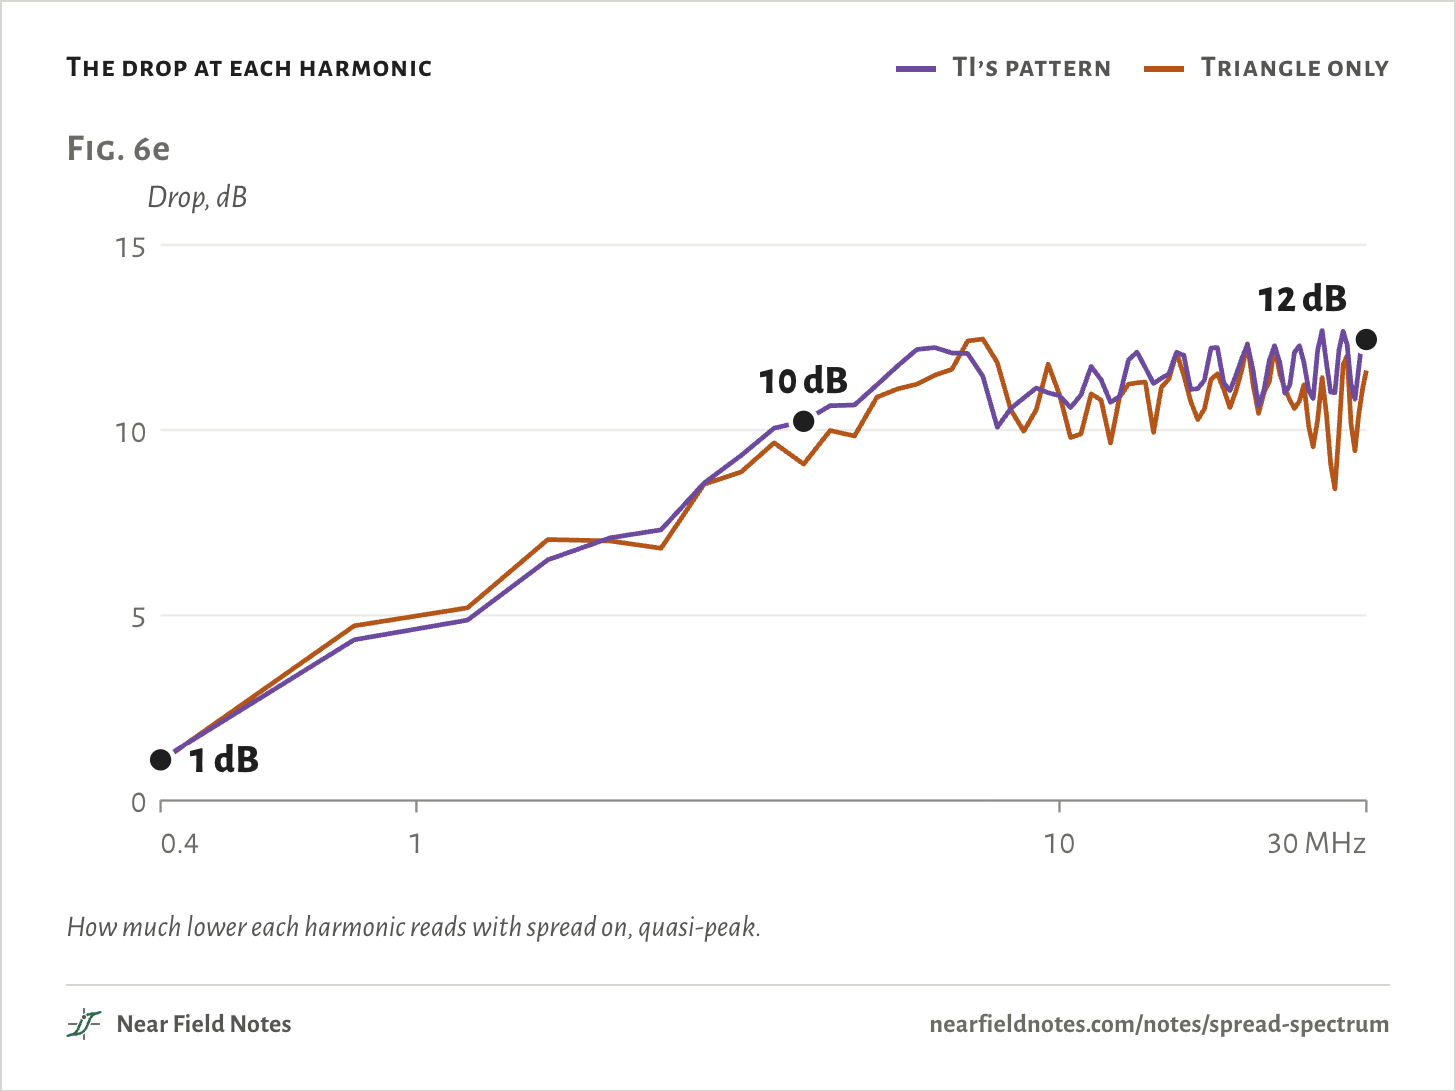
The drop at each harmonic
  • TI’s pattern
  • Triangle only
Fig. 6eDrop, dB5101500.41 MHz10301 dB10 dB12 dBFig. 6eDrop, dB5101500.411030 MHz1 dB10 dB12 dBFig. 6eDrop, dB5101500.411030 MHz1 dB10 dB12 dB

How much lower each harmonic reads with spread on, quasi-peak.

148

Key to spread spectrum

How much does spread spectrum take off each reading?

  1. 1aThe 400 kHz clock itself1 dB lower
  2. 1bA harmonicGo to 2
  3. 2aBelow 6 MHz10 dB lower at 4 MHz
  4. 2b6 MHz and up10 to 13 dB lower

At 30 MHz it reads 12 dB lower.

149

Conditions

Converter
LM62460, MNT Reform motherboard 3.0, U7
Input
25.6 V, 8S LiFePO4 pack
Output
5.0 V at 2 A
Switching
400 kHz, spread spectrum on
Spread
A 74 µs triangle of ±11.4 kHz plus a jump each cycle within ±5.5 kHz, up to ±16.9 kHz in all
Inductor
3.3 µH, PM2205.332NLT
Network
CISPR 16 50 µH / 50 Ω LISN at the bus
Receiver
9 kHz window, quasi-peak, 1 ms charge, 160 ms discharge
Reading
The highest within 200 kHz of each harmonic

TI publishes the spread's size but not its shape. The shape was measured from TI’s scope shot, datasheet SNVSBZ4A, Figure 8-11.

Limits

  • These levels are this buck’s alone, not a test of the Reform.
  • Below about 0.24 A of load the chip slows its clock, and the spread stops with it.
  • Other random seeds and another capacitor model keep the drops within 0.6 dB.

Files

  • ssim/ti_trace.pyThe pattern, measured from TI’s figure
  • ssim/emi.pyThe input current and the receiver

Sources

Like this note?

Rev 1 ·
  1. Rev 1First published

Each fix gets a line here, with the reader's name if they want credit.

Did it answer your question?

Want more on this?

Report a problem

What should the next note be? Ask for one